
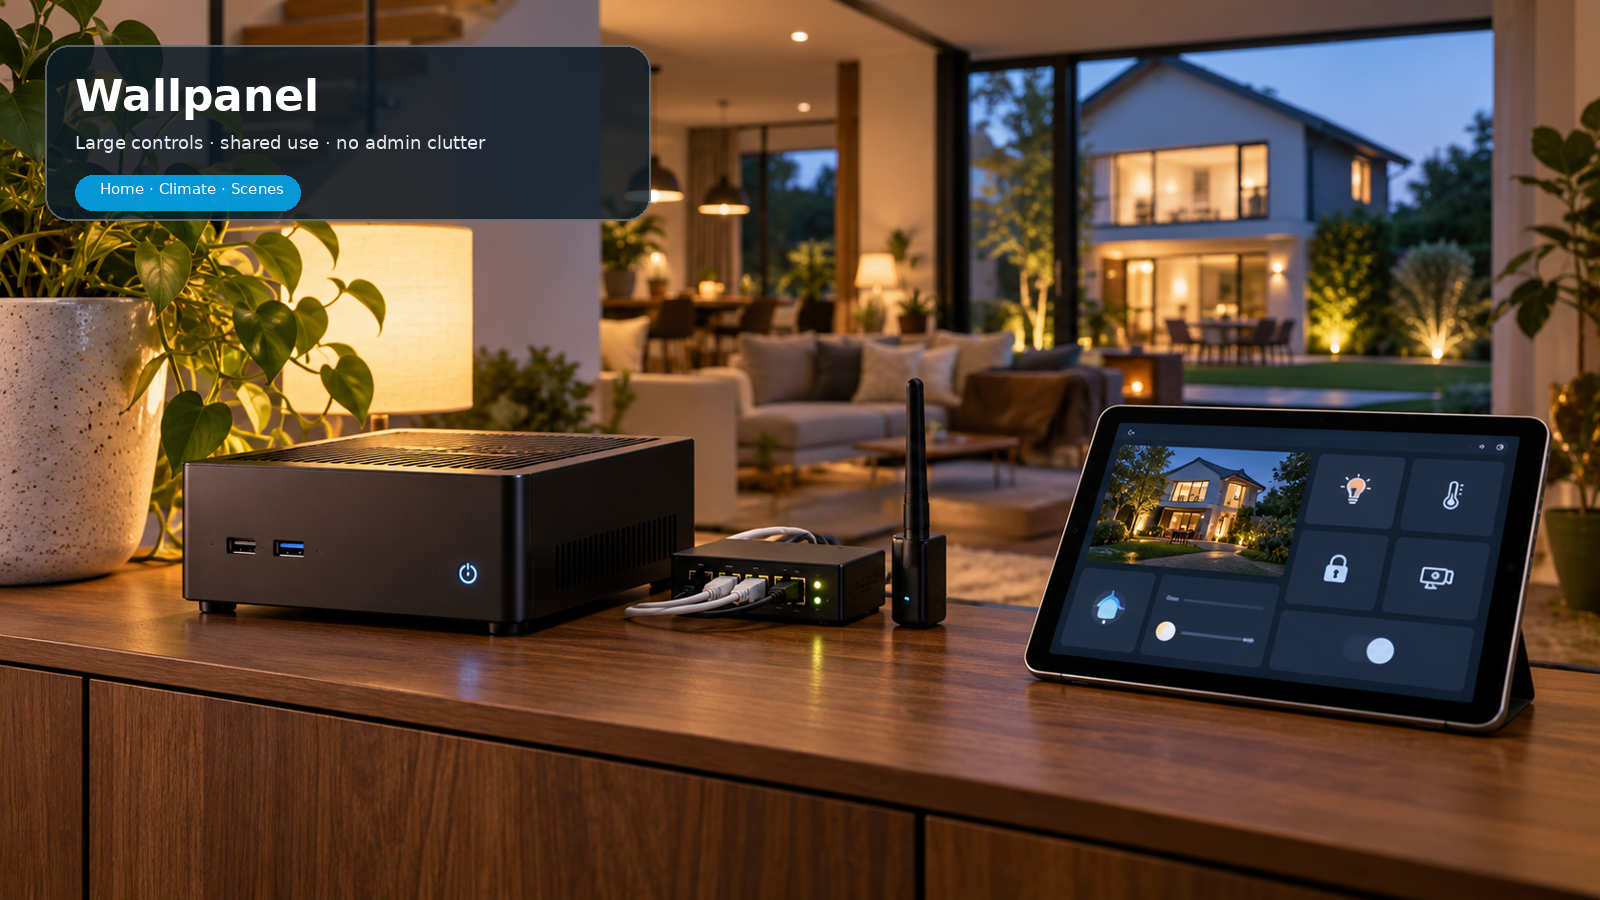
From Areas and Sections to Tile cards, visibility, subviews, mobile layouts, wallpanels and maintenance: this expanded beginner’s guide goes deeper into the reasons, settings and practical design decisions behind Home Assistant dashboards.
Current as of October 2026: this guide follows the current Home Assistant dashboard structure. Sections is the default view for custom dashboards. The built-in default starting environment is now called Overview. The examples reflect Home Assistant 2026.10, including its expanded visibility conditions. The source images are realistic example mockups in the current Home Assistant style; values and entity names are illustrative.
1. What is a dashboard – and what is it not?
A dashboard is the presentation layer of your smart home. It is not a place to display all your technology. Automations, templates, helpers, MQTT sensors and diagnostic data can do their jobs very well behind the scenes without being permanently visible.
A good dashboard does three things: it provides status, offers the most frequently used controls and leads you to details when needed. It therefore does not have to contain everything Home Assistant knows.
The built-in Overview environment
Since 2026.2, the new Overview has been the default starting environment for new installations. It is built automatically from Areas and devices. That is useful as a starting point and inspiration, but people who want real control over layout and information hierarchy usually create their own dashboard alongside it.
Design question: do not ask, “Which entities can I display?” Ask, “Which decision or action should this information support?”
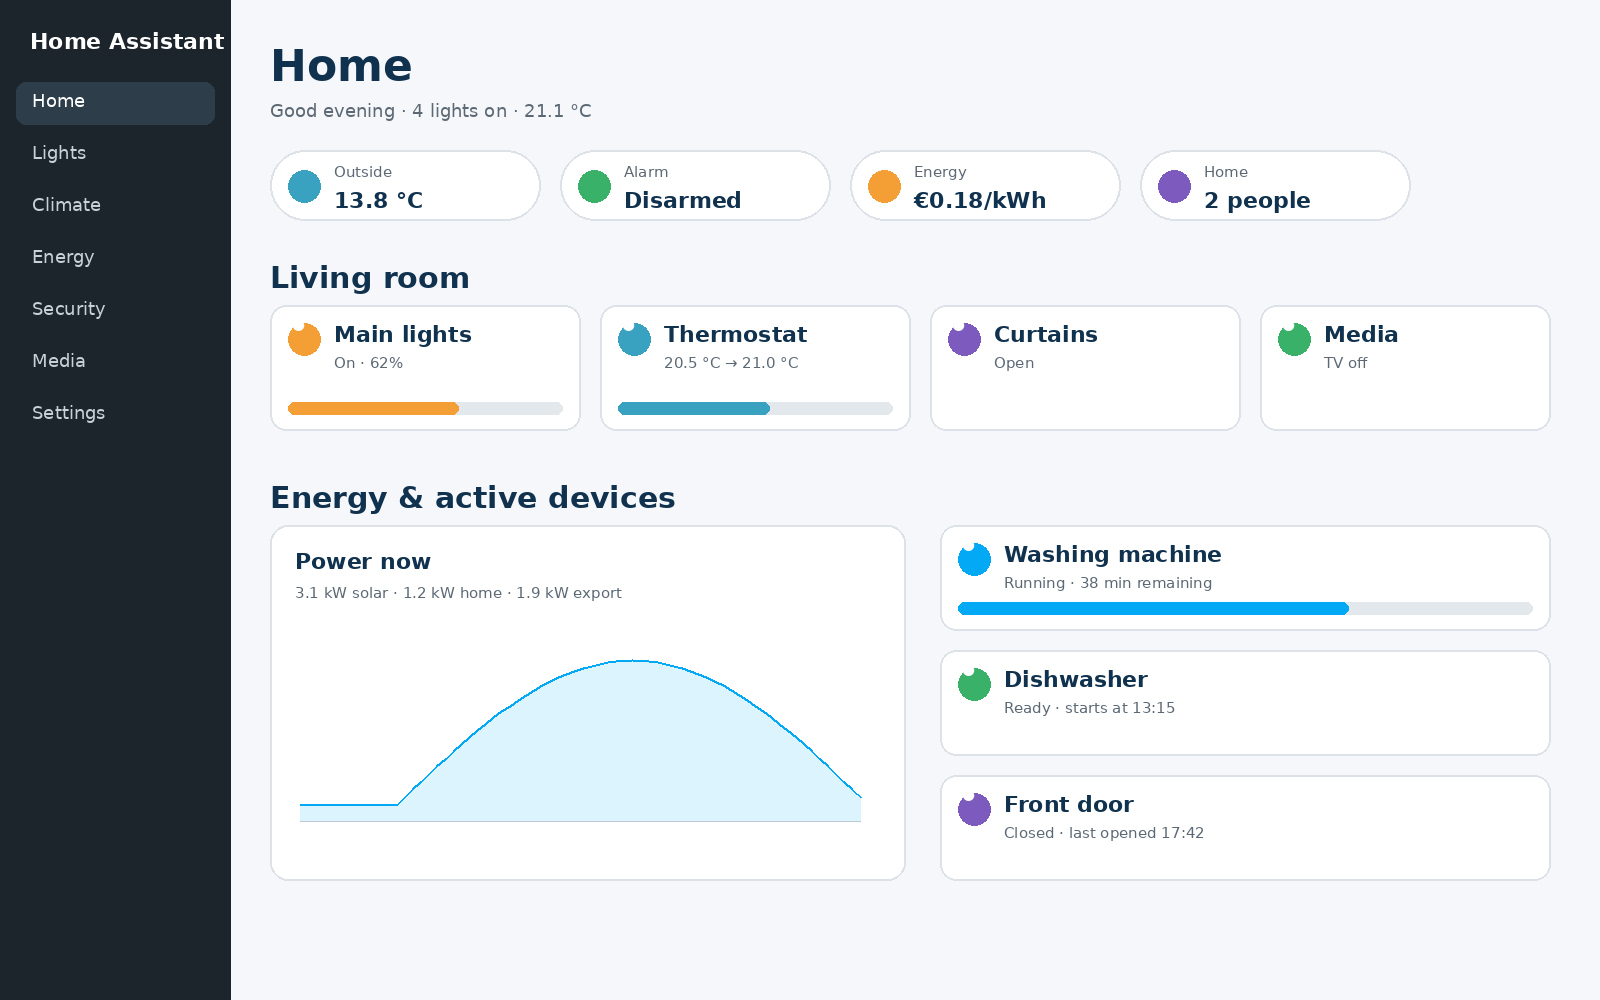
2. The hierarchy: Dashboard → View → Section → Card
These four levels are the grammar of a dashboard. If you confuse them, the dashboard quickly becomes cluttered.
- Dashboard: the complete environment, for example Home, Wallpanel or Technology. A dashboard can contain several views.
- View: a tab or page within the dashboard, for example Home, Energy, Climate or Security.
- Section: within a Sections view only, a logical group of cards, such as Living room or Active appliances.
- Card: the actual element that shows information or provides a control.
A calm custom Home view puts key status at the top, followed by logical sections and only active or important appliances.
3. Organise first: Areas, Floors, devices and entities
Dashboard quality starts before the first card. If devices are not assigned to Areas and names are inconsistent, you will have to repair that on every card later.
Areas represent real rooms or functional zones. Floors group Areas by storey. Devices are physical or logical appliances; entities are their individual measurement or control functions.
Good preparation
- Create Areas that match spaces people recognise: Living room, Kitchen, Bathroom, Garage.
- Use Floors if you have several storeys; this helps Overview and administration.
- Assign a device to the correct Area rather than scattering its individual entities, wherever possible.
- Give devices and entities human-readable names. “Living room ceiling” is better than “Light group 2”.
- Choose each Area’s primary temperature and humidity sensor when relevant.
Why this matters so much
Area cards, Overview, Assist and much automatic grouping benefit from a sound structure. Your dashboard becomes less like a manually maintained spreadsheet and more like a genuine representation of your home.
4. Create your own dashboard: a safe first workflow
For serious customisation, create your own dashboard via Settings → Dashboards → Create. That leaves the built-in Overview intact and lets you experiment without sacrificing your default view.
A practical starting sequence:
- Create a dashboard named “Home”.
- Add one view named “Home”.
- Choose Sections as the view type.
- For now, choose a maximum of 3 or 4 sections side by side on desktop.
- Leave Dense section placement off initially if exact order matters.
- Add 3-5 badges for genuinely important status.
- Create 3 or 4 sections: Climate, Lighting, Energy/Active, Security.
- Test on mobile before expanding further.
Do not immediately create ten views: extra views may appear to bring order, but often just move the clutter to a tab strip. Add a view only when it has a clearly different information purpose.
5. The four view types: when should you choose each?
| View | Strength | Suitable for | Limitation |
|---|---|---|---|
| Sections | Grid, sections, drag & drop, resize | Almost every daily dashboard | Requires deliberate structure |
| Panel | One full-width card | Map, floor plan, large camera, webview | Exactly one card, no badges |
| Sidebar | Wide main area plus narrow column | Monitoring on a large screen | Composition changes on mobile |
| Masonry | Automatic columns | Older dashboards or a free mix of cards | Less predictable placement |
For a new dashboard, Sections is almost always the first choice. Panel works well for one dominant visual. Sidebar and Masonry are more specialised.
6. Sections in depth
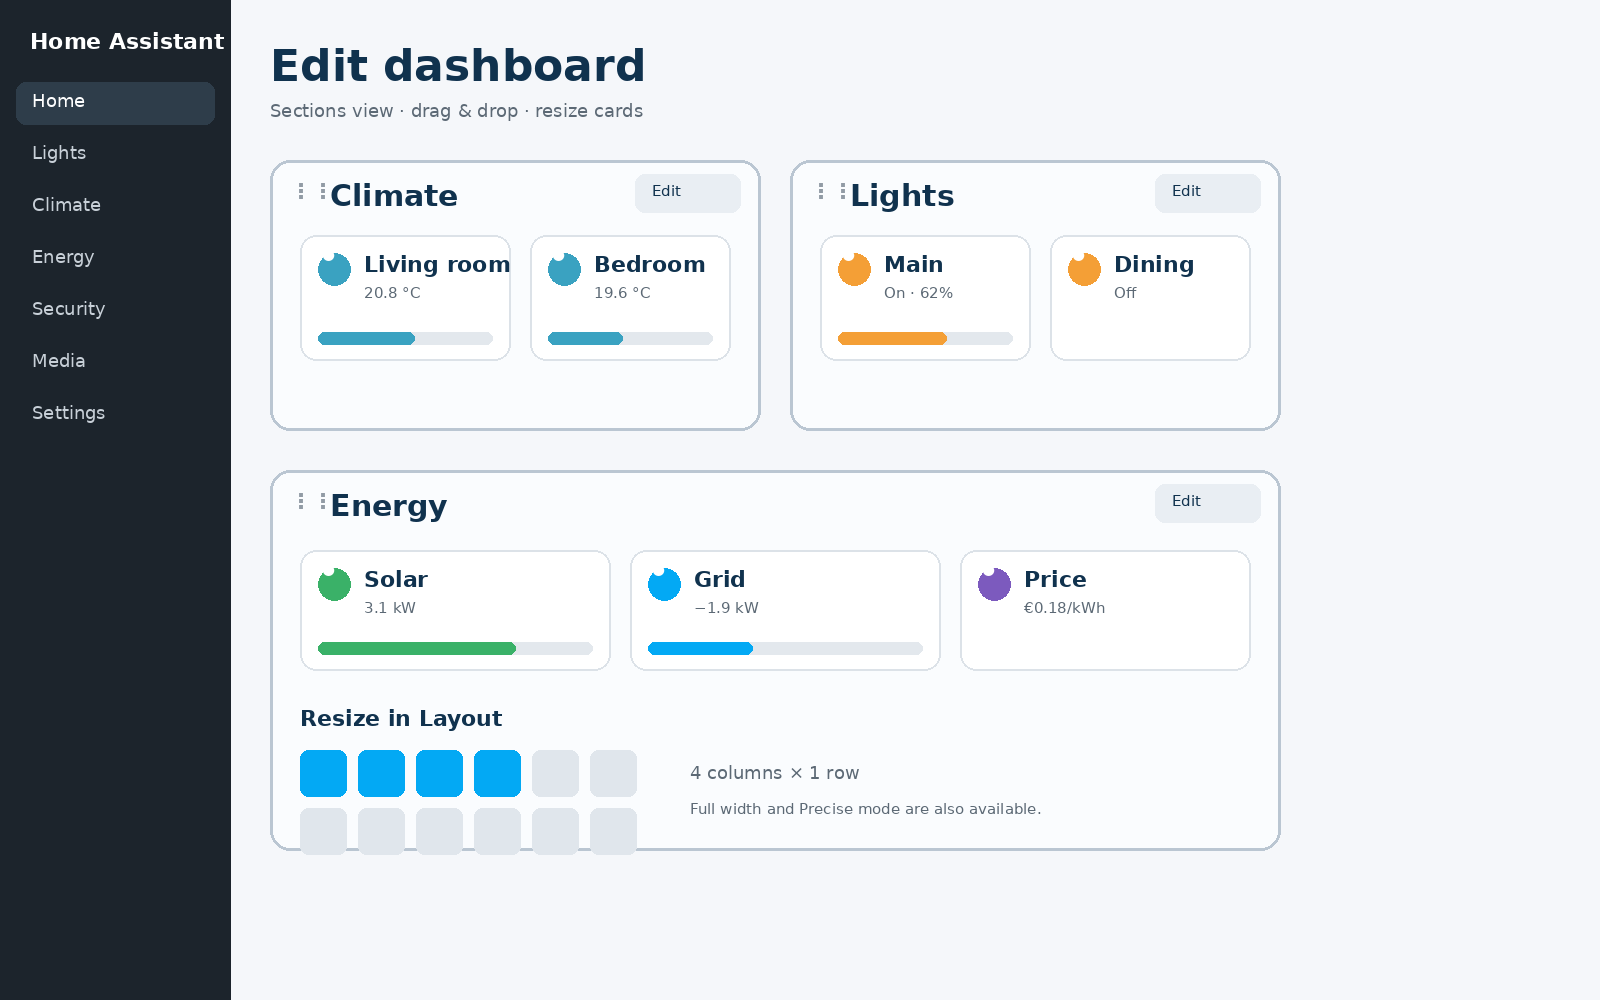
Sections is more than “cards in boxes”. It is a grid layout where you create groups, drag cards, resize them and make complete sections conditionally visible.
Important settings
- Max number of sections wide: sets how many sections may appear side by side.
- Dense section placement: automatically fills horizontal gaps; useful for compact layouts, less suitable when a fixed order is essential.
- Section background: since 2026.4 you can give sections a background colour and opacity. Use this sparingly to group information, not as a decorative rainbow.
- Layout tab: cards in a Sections view can be made larger or smaller. Full width and Precise mode offer more control.
- Sections internally use a 12-column grid. Custom cards can also offer explicit sizing for it.
7. Header, title and badges: the dashboard begins at the top
The header of a Sections view can contain a title and badges. This is the right place for information that is almost always relevant and needs little space.
Good badges
- Alarm status.
- Presence / someone at home.
- Outside temperature.
- Current electricity price.
- One important fault or notification.
Bad badges
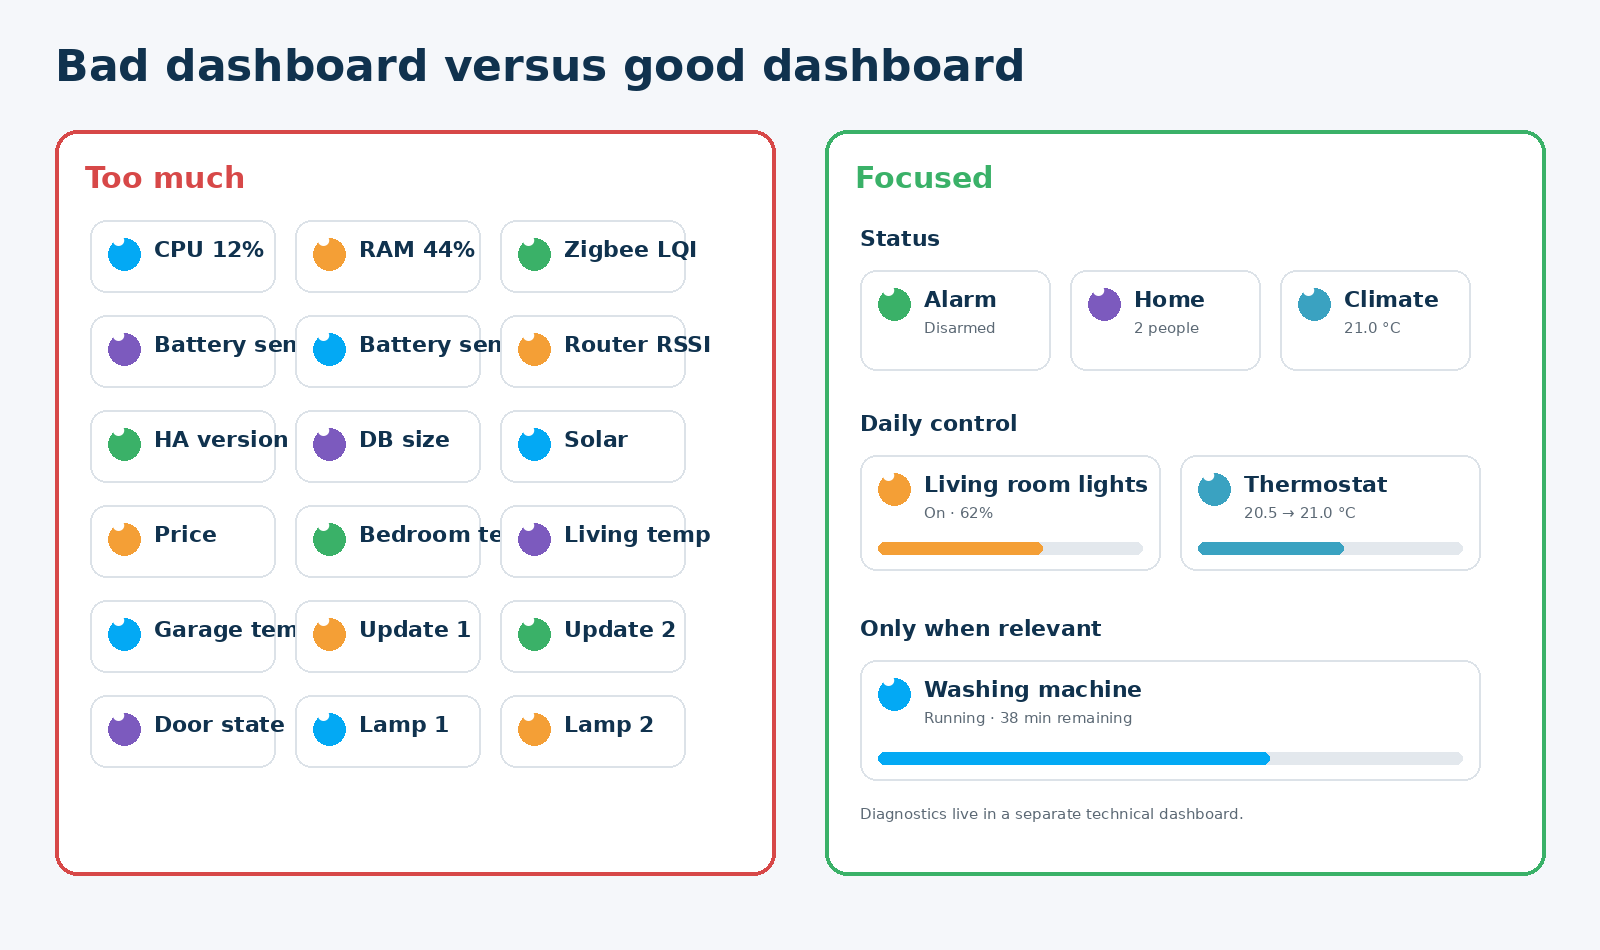
- Battery levels of twenty sensors.
- Every window contact separately.
- CPU and RAM.
- Every temperature reading in the house.
A badge should convey something at a glance. Use cards, subviews or a technical dashboard for details.
8. Heading cards: structure, context and navigation
The Heading card is one of the most underestimated parts of a modern dashboard. It does more than display a title: it can have an icon, actions and small badges, making an entire section understandable.
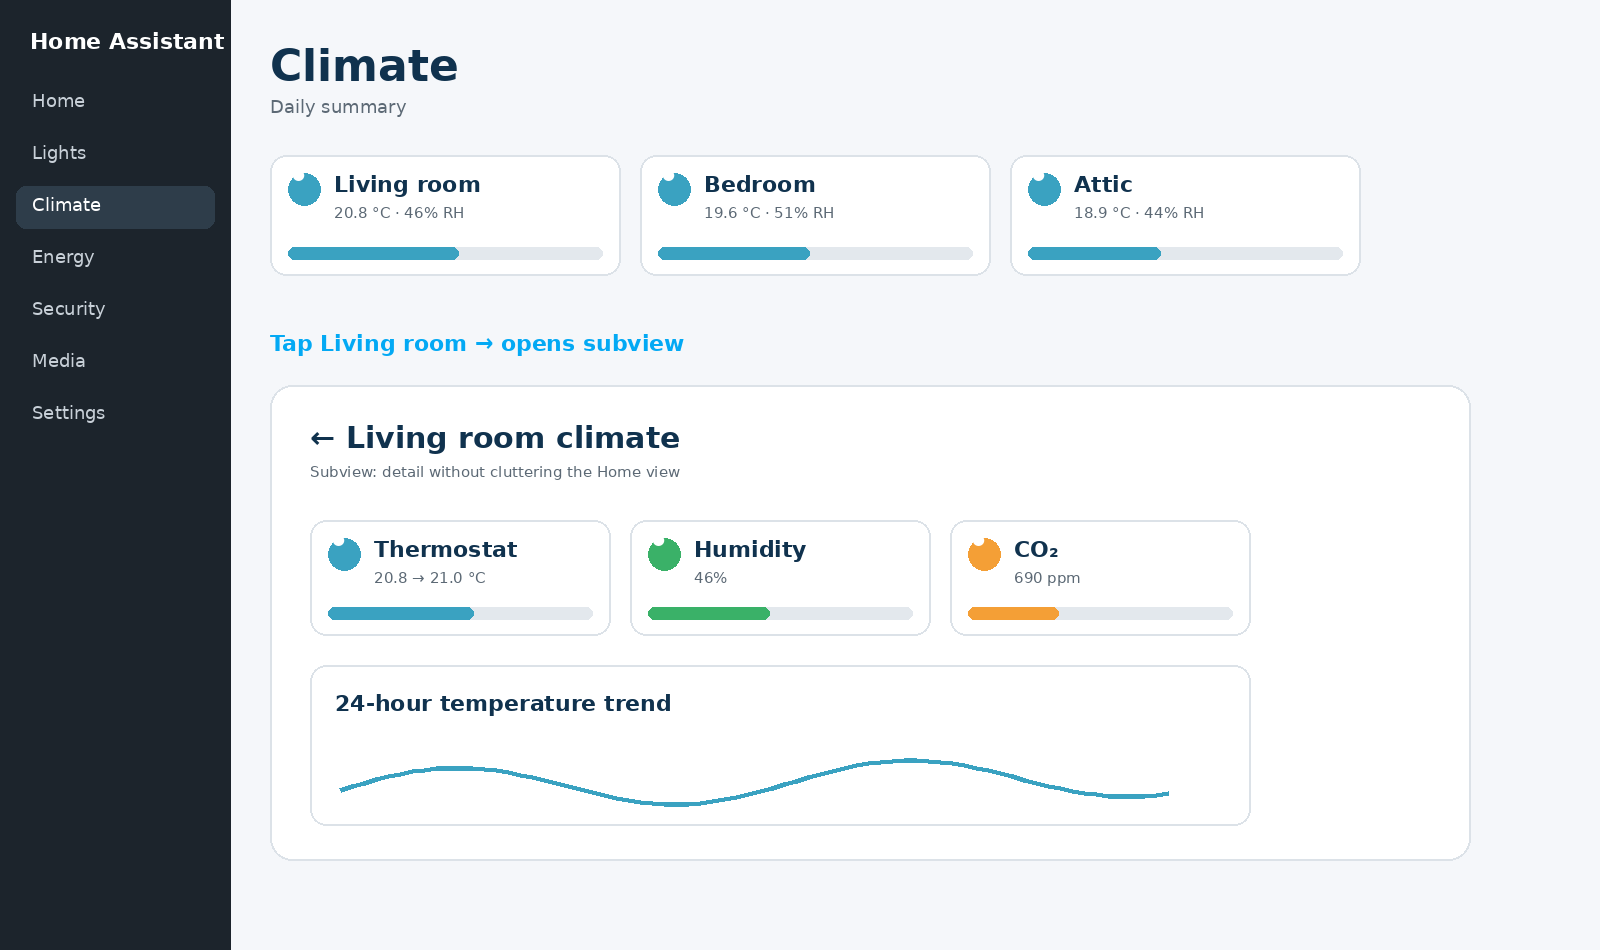
For example, a “Living room” Heading can have temperature and humidity as heading badges on the right. Tapping the heading navigates to a Living room subview. Only daily Tiles appear below it.
Use heading_style: title for a genuine section heading and subtitle for smaller subdivisions. This creates hierarchy without extra decorative cards.
Strong pattern: Heading = “what is this group about?” Tiles = “what do I want to know or do now?” Subview = “where are the details?”
9. Tile cards: the default building block for daily control
The Tile card offers status, name and quick control in a compact format. For many domains – lights, covers, climate, media, vacuums, timers and helpers – it should be the first card you try.
Important Tile options:
- Override name, icon and colour.
- Use
state_contentfor state, last changed, last updated or attributes. - Use vertical layout for large touch controls.
- Hide state when name and feature already tell the story.
- Tap, hold and double-tap actions.
- Separate icon actions.
- Add features at the bottom or inline.
Features make a Tile powerful without extra cards: think dimmer, cover open/close, thermostat setpoint, vacuum commands, timer actions or a script button.
10. Which cards are truly useful for beginners?
Not every card deserves a place on your daily dashboard. The most important native cards each have a clear role.
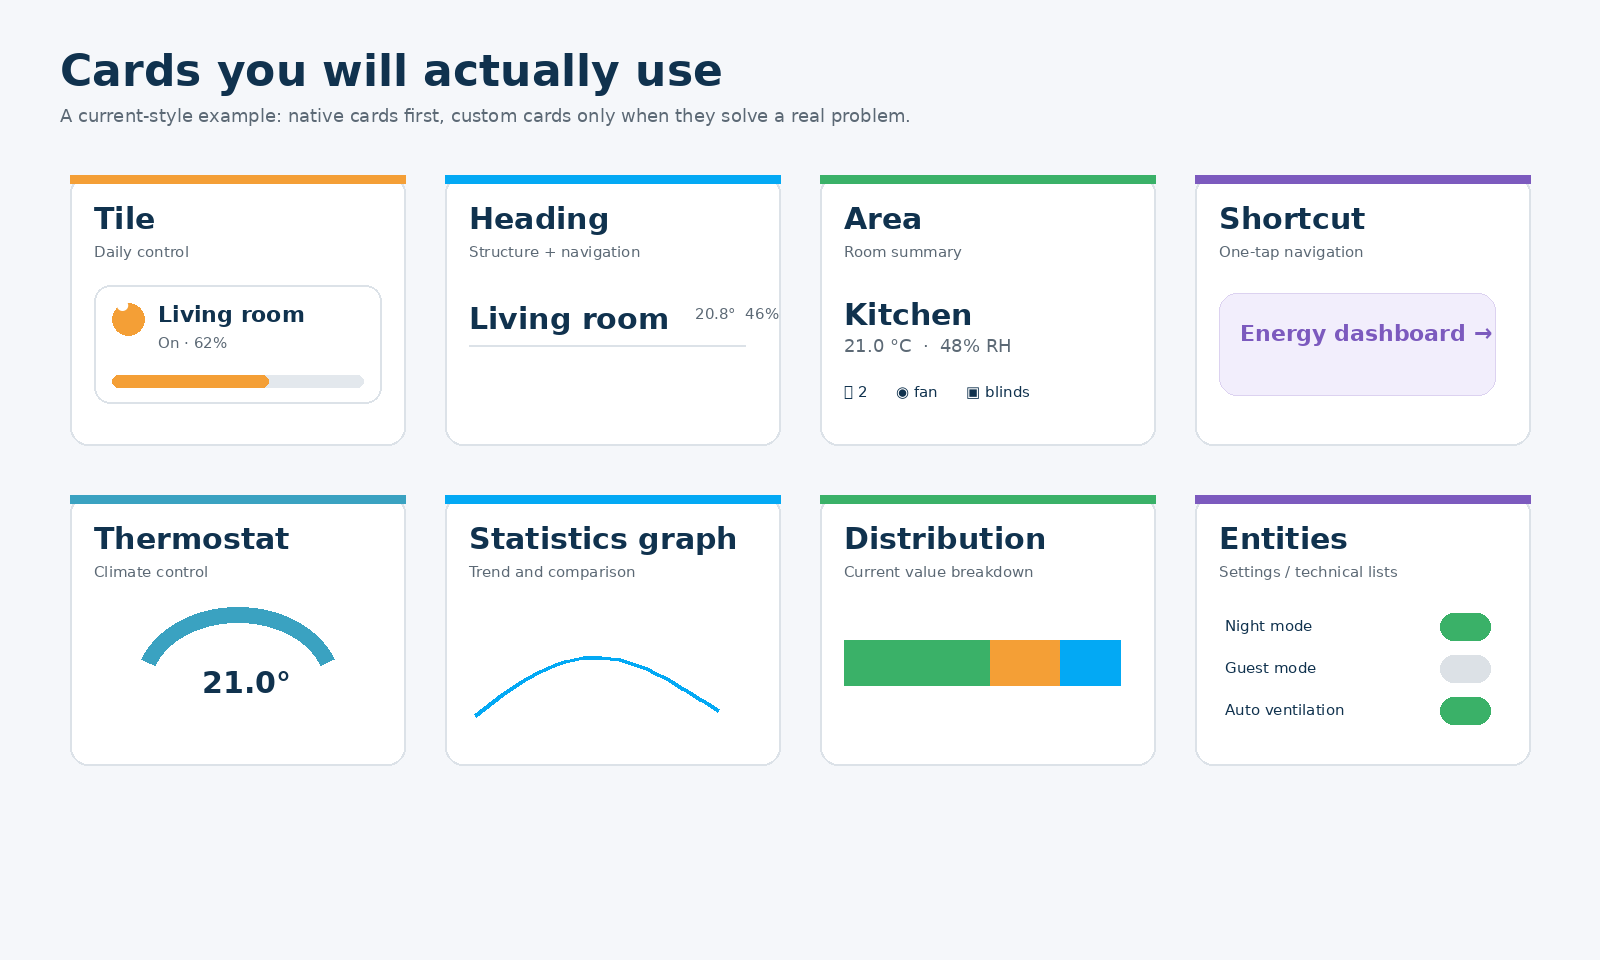
Area is useful for a room overview; Shortcut for one-tap navigation or Assist; Distribution for the current breakdown of, for example, power; Statistics graph for trends; and Entities for settings and technical lists. Use Thermostat only when you really need its larger controls; a Tile is often enough on a compact Home view.
11. Shortcut and Distribution: two modern cards that are often overlooked
Since 2026.5, the Shortcut card has been intended for direct actions and navigation without necessarily needing an entity behind it. That makes it ideal for “Open energy”, “Open cameras”, “Start Assist” or an external guide.
The Distribution card was added in 2026.2. It shows current values of related entities as segments in one horizontal bar. This is powerful for energy: for example, you can see how current power is divided among a heat pump, boiler, EV and other consumers.
Use Distribution for present-day proportions, not as a historical graph. Use Statistics graph when time and trend are the focus.
12. Actions: tap, hold, double-tap and navigate
A dashboard becomes usable only when the same interaction means the same thing everywhere. Home Assistant supports different actions, but “available” does not mean “required”.
My practical default:
- Tap the card: open more-info or navigate to detail.
- Tap the icon: toggle when that is logical and safe.
- Hold: only for a secondary function that is not essential.
- Double-tap: almost never on family dashboards; it is too hidden.
- Navigate: ideal for Heading and Shortcut cards leading to subviews.
A human interface: a function that nobody can discover without an explanation effectively does not exist. Keep critical controls visible.
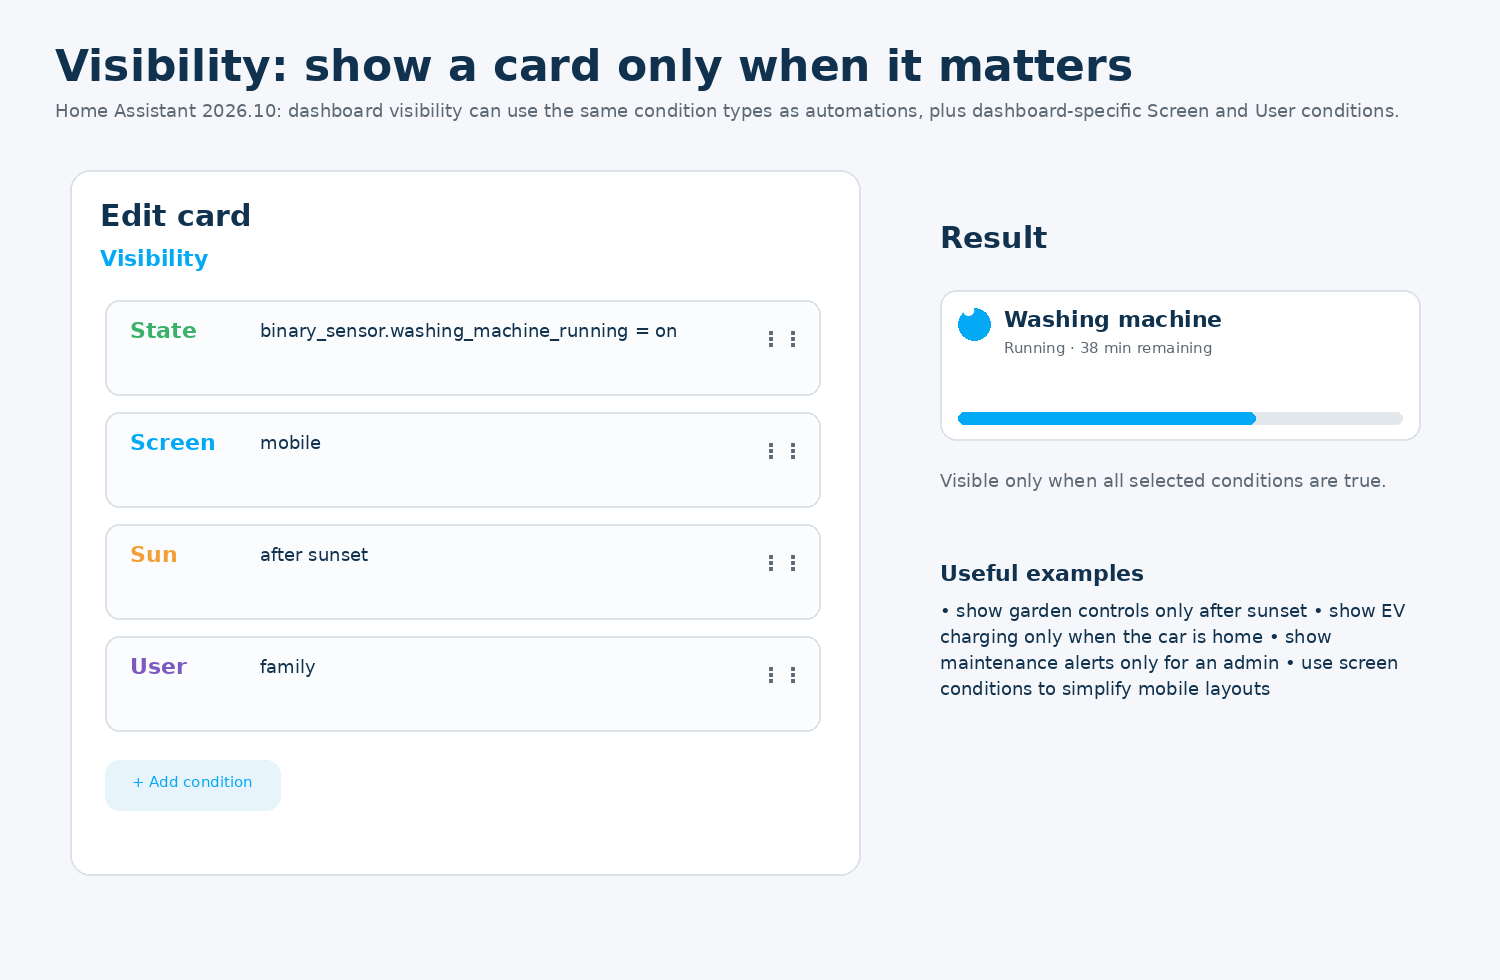
13. Conditional visibility – much more powerful in 2026.10
Since Home Assistant 2026.10, the Visibility tab can use the same kinds of conditions as the automation editor, supplemented by dashboard-specific conditions such as Screen and User. This lets you determine much more precisely when a card, badge or section appears.
Strong applications:
- Show garden lighting only after sunset.
- Show EV charging only when the car is in the home zone.
- Show the washing-machine block only while running or finished.
- Show maintenance warnings only to an administrator.
- Display fewer cards on mobile than on a tablet.
- Make cameras prominent when Alarmo is pending or triggered.
If several conditions are set, they are evaluated together according to the chosen condition structure. Use visibility to reduce noise, not as a substitute for security permissions.
14. Per user: personalisation is not security
Views can be made visible to particular users. That is useful for an admin tab or a personal view. But Home Assistant rightly warns that view visibility mainly hides the tab; the URL may still be accessible.
Use user visibility for personalisation: a simpler family screen, your own work view or an admin tab. For real security, use accounts, permissions and safe service calls – not merely a hidden tab.
15. Subviews: the way to keep detail off your Home view
A subview is a view that does not appear as a normal navigation tab. You open it through navigate actions and get a back button at the top. This lets you combine one tidy main view with detailed pages.
Typical subviews include living-room climate, energy prices, camera detail, boiler history, a washing-machine cycle or Zigbee diagnostics. The main view stays calm while information remains available.
16. Mobile first: a phone is not a small desktop
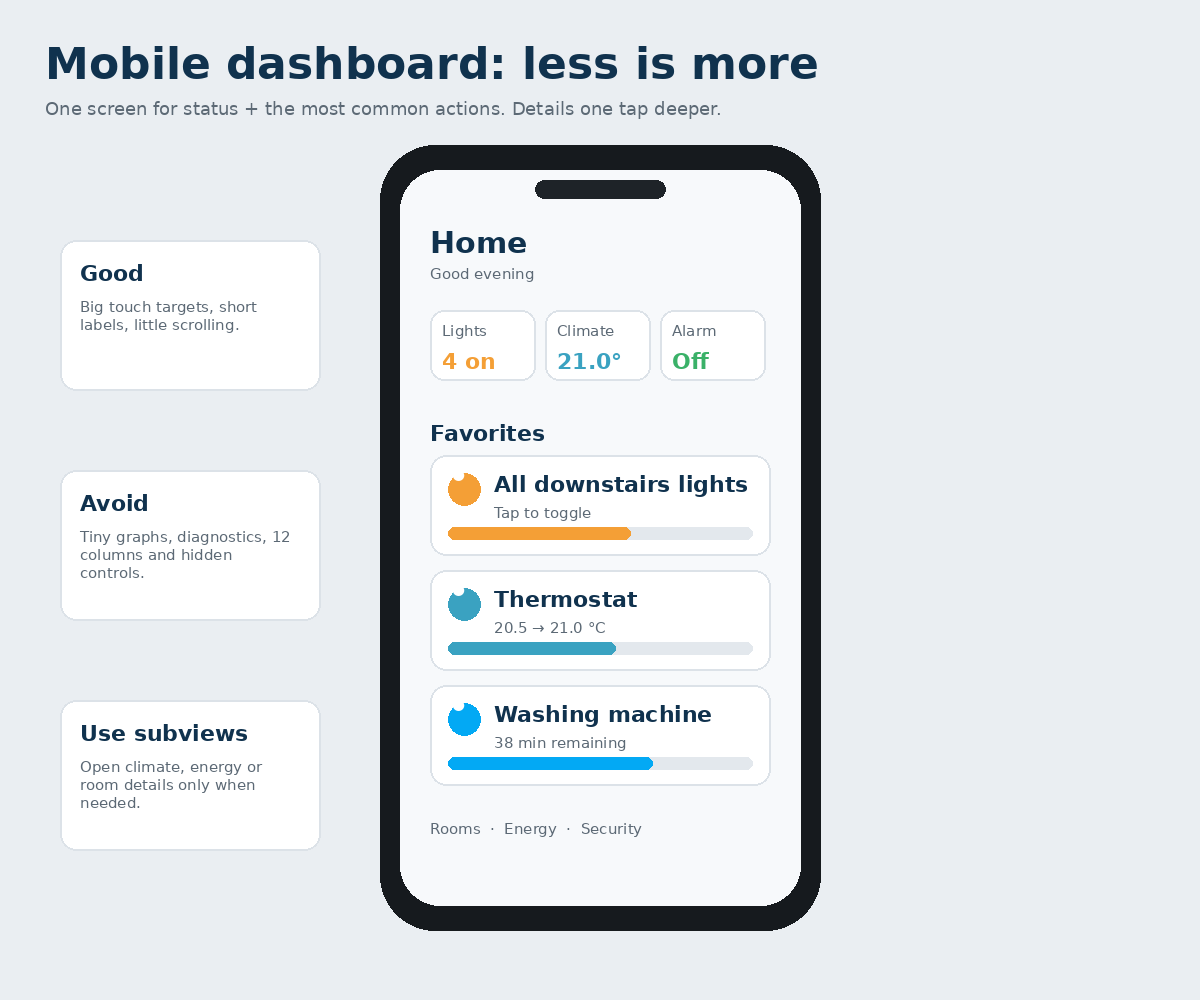
On mobile, width, thumb-friendly control and speed matter more than completeness. In 2026, the built-in Overview shows summary cards at the top on mobile. This is a good design principle for custom dashboards too: summary first, then favourites, then rooms.
Mobile rules:
- Large touch targets.
- Limit the first screen to core status and daily actions.
- Show graphs only when they are genuinely useful.
- Avoid long technical tables.
- Put detail in subviews.
- Use Screen visibility when a card is useful only on mobile, or specifically not on mobile.
17. Tablet and wallpanel: shared control at home
A wallpanel is not a personal dashboard. It hangs in a fixed location, several people use it and it must make sense without explanation. That means larger controls, a stable structure and few administrative functions.
What works well on a wallpanel:
- Lighting by room.
- Climate status and simple setpoint control.
- Scenes such as Movie night, Away and Bedtime.
- Alarm status.
- Active appliances.
- Possibly a camera or doorbell when relevant.
What usually does not belong there: integration updates, Zigbee LQI, AppDaemon logs, YAML helpers and experimental cards.
18. Desktop: more room does not mean everything must be visible
On desktop you can show three or four sections side by side and use larger graphs. The information hierarchy should nevertheless remain the same. A desktop dashboard is not an excuse to put every entity on one page.
Use extra width mainly for context: an energy graph beside current power values, or climate trends beside the thermostat. Keep technical settings one level deeper.
19. One dashboard, several dashboards or several views?
Home Assistant supports multiple dashboards. That is useful when screens genuinely serve different purposes. A wallpanel and a technical administration dashboard, for example, are fundamentally different.
A practical division:
- Home: daily use by residents.
- Wallpanel: large, shared, little navigation.
- Technology: diagnostics, batteries, network, updates, MQTT, storage.
- Personal: only if you use specific information others do not need.
Keep as few views within each dashboard as makes sense. Many views do not automatically improve clarity; subviews may be better.
20. Dashboard by room: when is an Area card enough?
For simple rooms, one Area card may be sufficient. It can show relevant devices and sensors from that Area and offer certain controls. This works well when the room is simple.
For a living room with lighting, climate, media, curtains and presence, a dedicated section or subview is often clearer. Use a Heading with small badges, 2-4 Tiles for daily control and perhaps one graph for a meaningful trend.
Avoid five different cards all showing the same temperature again.
21. Climate dashboard: what is useful?
A good climate dashboard does not display every thermal sensor; it makes the situation understandable. A logical main view shows current temperature and setpoint for each important zone, perhaps with humidity or CO₂. History and technical supply/return temperatures belong in detail views.
On the main level
- Current temperature.
- Target temperature.
- Heating active: yes or no.
- One air-quality signal if relevant.
- Ventilation status if residents actually control it.
In a subview
- 24-hour trend.
- Humidity/CO₂.
- Boiler/heat-pump power.
- Ventilation mode.
- Technical sensors and thresholds.
22. Energy dashboard: built-in Energy versus your own operational view
The built-in Energy dashboard is strong for historical energy analysis. A custom energy view serves a different purpose: what is happening now, and should I do something?
Your own operational energy view might therefore show current PV power, grid import/export, electricity price, active large consumers, a battery or EV, and perhaps a Distribution card. Leave historical day/month/year comparisons mainly to the built-in Energy dashboard.
Two different questions: Energy dashboard: “What did we consume and generate?” Custom energy view: “What is happening now, and what can I respond to?”
23. Security: make status prominent, cameras only when relevant
For security, you primarily want to know immediately whether the system is normal. Alarm status, open entry points and genuine notifications belong above technical camera details.
With visibility, you can make a camera or alarm section prominent only when the alarm is pending or triggered, or a door is open while nobody is home. That makes security information more noticeable precisely when it matters.
A permanent grid of six camera streams on every dashboard takes space and resources and is often ignored.
24. Partner and family: the ultimate usability test
A dashboard is not good just because you understand it. It is good when the people who use it daily intuitively know what to do.
Design for people, not entity IDs:
- Human-readable names.
- Consistent icon meanings in every view.
- Tap always performs the expected primary action.
- No important function hidden behind hold or double-tap.
- Scenes named things like “Movie night” and “Bedtime”.
- Status readable without relying on colour vision or technical knowledge.
Let someone else use the dashboard without explaining it. Every question you then need to answer is free UX research.
25. What does not belong on your Home view?
Technical information is not worthless; it is often simply in the wrong place. Batteries, RSSI, link quality, database size, update entities, CPU load and debugging helpers belong on a technical dashboard or maintenance subview.
The Home view is about daily living. If you need technical data only during a fault, it can become visible only when there is a fault.
26. Custom cards, HACS and maintenance
Native Home Assistant cards have become powerful enough to build a professional dashboard. This matters for beginners: fewer dependencies, less risk that a frontend update breaks a crucial card, and less YAML to maintain.
Custom cards make sense when they solve a concrete problem that native cards do not address well. Document which HACS resource they need, and do not build all your basic controls exclusively on one community card.
Custom cards must support correct Sections sizing too. Older cards may work technically but scale poorly in the modern grid layout.
27. YAML versus the visual editor
A beginner’s dashboard does not need YAML. Home Assistant can build dashboards visually, drag and resize cards, set actions and configure visibility. Use the visual editor as long as it meets your needs.
YAML becomes interesting when you want to copy configuration, use version control, need very specific options or maintain many repeated patterns.
A simple Tile in YAML:
type: tile
entity: light.woonkamer
name: Woonkamer verlichting
features_position: inline
features:
  - type: light-brightness
YAML is not an end in itself. A good dashboard matters more than a technically impressive one.
28. Common dashboard mistakes – and how to recognise them
- Showing everything “because you can”.
- Giving every sensor its own card.
- Making no distinction between status, control, detail and diagnostics.
- Building for desktop and discovering only later that mobile is unusable.
- Using too many colours without meaning.
- Giving every room a separate view when a section would suffice.
- Hiding essential functions behind hold or double-tap.
- Installing custom cards before knowing which problem they solve.
- Using visibility as security.
- Showing graphs nobody uses to make a decision.
The solution is almost always the same: remove, group and move detail one level deeper.
29. Building method: from an empty dashboard to a strong first version
Follow this order and pause to test after each step:
- Tidy up Areas, Floors and names.
- Create a new “Home” dashboard.
- Create one Sections view called “Home”.
- Add 3-5 core badges.
- Add 3-4 sections with Headings.
- Use mainly Tiles for daily control.
- Create one Climate subview and one Energy subview.
- Add visibility for temporary information.
- Test on phone, desktop and wallpanel.
- Only then create a technical dashboard and add custom cards.
Stop rule: can you not explain why a card is on the Home view? Remove it temporarily. If you miss it, you can always put it back.
30. Final check: is your dashboard really good?
Go through these questions after using your dashboard for a week:
- Can I see within two seconds whether anything important is wrong?
- Can I reach the five most common actions with one tap?
- Can someone else at home use this without explanation?
- Is the mobile view pleasant to use with one hand?
- Is the wallpanel calm enough for shared use?
- Are graphs present only where trends matter?
- Does temporary information appear only when relevant?
- Have technical details been removed from the Home view?
- Am I using native cards where they work well?
- Do I have more views than real information purposes?
A good dashboard is never “finished”. But it need not be constantly rebuilt either. Stability and predictability matter more in the end than adopting every new frontend feature immediately.
31. Current Home Assistant notes and sources
This expanded edition has been updated using the current Home Assistant documentation and release information from October 2026.
Important current points: Sections is the default view for new custom dashboards; view types are Sections, Panel, Sidebar and Masonry; the built-in default environment is called Overview; cards in Sections can be resized; sections have supported background colours since 2026.4; Shortcut arrived in 2026.5; Distribution in 2026.2; and the Visibility editor gained much wider-ranging conditions in 2026.10.
Official documentation
- home-assistant.io/dashboards/
- home-assistant.io/dashboards/sections/
- home-assistant.io/dashboards/views/
- home-assistant.io/dashboards/cards/
- home-assistant.io/dashboards/tile/
- home-assistant.io/dashboards/heading/
- home-assistant.io/dashboards/area/
- home-assistant.io/dashboards/shortcut/
- home-assistant.io/dashboards/distribution/
- home-assistant.io/blog/2026/10/07/release-202610/
The heart of this guide: a dashboard is not a showcase for every Home Assistant entity. It is an interface for people. Show the right information, on the right screen, at the right time.