
The complete technical explanation: from 253 volts and voltage rise to reliable measurements, practical remedies and monitoring with Home Assistant.
On a bright day with hardly a cloud in sight, your solar installation suddenly stops producing. The inverter app reports Grid Overvoltage, AC Voltage High, Grid Fault or a similar message. Some time later the system starts producing again, only to shut down once more. What is happening?
Often the inverter is not defective. Instead, the voltage it measures at its own AC connection point is too high. When exporting energy, current flows opposite to the usual direction: from the home towards the low-voltage grid. That current creates a voltage difference across cables and connections. During strong solar production, the voltage at the inverter can rise to the protection threshold.
This protection is not an inconvenient software issue to program around. It is part of grid safety. The right sequence is understand, measure, locate the cause, and only then correct it.
In brief: Dutch nominal voltage is 230 V. At 253 V it is 10% higher. Grid-connected inverters must operate with the applicable Dutch grid-protection settings. In many cases, shutdowns can be reduced by having faults or excessive impedance in your own AC circuit remedied. If the voltage at the grid operator’s connection point is itself too high, a structural remedy will often involve the grid operator.
Guide to this article
This guide starts with operating principles and safety. It then covers voltage limits, the physics, specific worked examples, differences between inverter types, measurement strategies, a Home Assistant example, and a diagnostic and remedial plan. All charts are illustrative unless stated otherwise. They are not measurements from a real home or a certified voltage-quality assessment.
1. What is high grid voltage?
A Dutch low-voltage supply normally provides 230 volts between phase and neutral and, on a three-phase connection, approximately 400 volts between two phases. These values are nominal: actual voltage varies with demand, local generation and grid impedance.
A home might measure 229 V in the evening when consumption is high and 247 V on a sunny afternoon. This does not automatically indicate a fault. Under the same conditions, however, an inverter may measure more than the smart meter, because the export current also produces a voltage difference along the cable from inverter to distribution board.
Voltage at one point is therefore not necessarily the same as voltage elsewhere in the installation. Where a measurement is taken matters as much as its value.
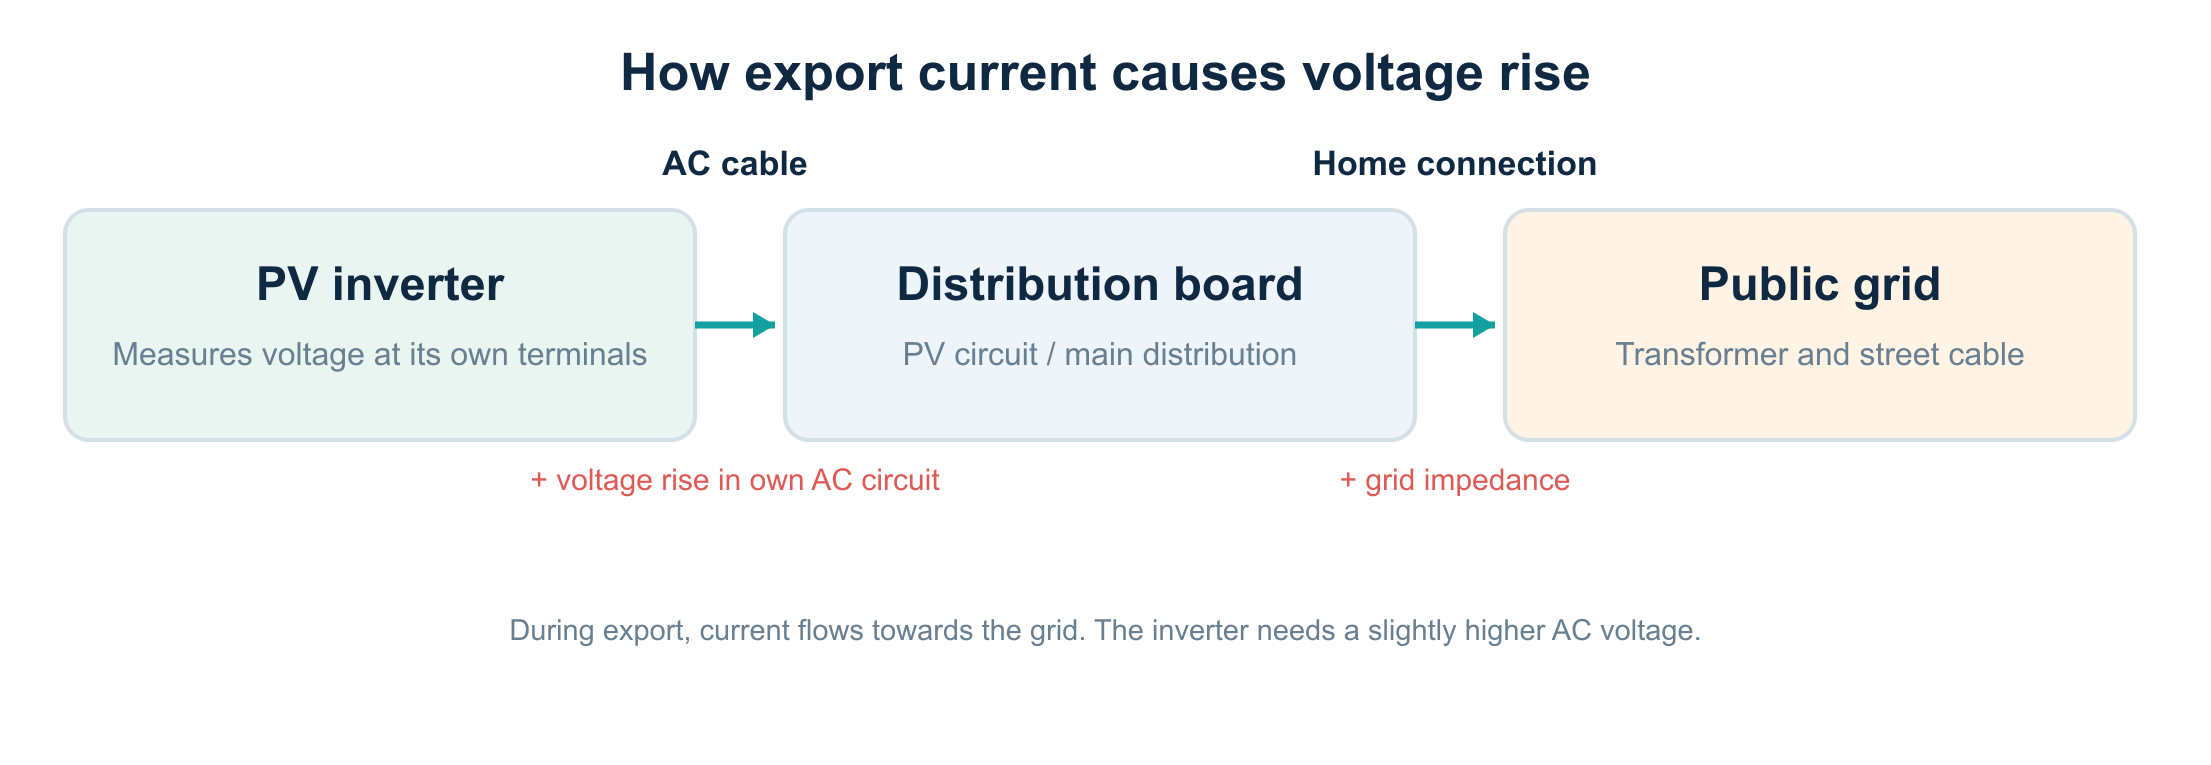
1.1 From energy flow to voltage rise
During normal consumption, electrical energy flows from the grid to devices in the home. Current causes a voltage drop across supply cables. With solar generation, the local direction of energy flow reverses. The inverter must establish a sufficiently high AC voltage at its output to send current towards the grid. Cable and connection resistance and reactance affect how much higher it must be.
Viewed from the grid connection point, the same physical cable therefore causes a voltage drop during consumption and a voltage rise during export. This is known as voltage rise.
2. Why is 253 volts the familiar threshold?
Nominal phase voltage is 230 V. Ten percent above that is straightforward to calculate:
230 V × 1.10 = 253 V.
For grid-connected PV inverters in the Netherlands, a protection setting requires shutdown when the permitted upper limit at the inverter’s own AC terminals is exceeded. A technical study for the Dutch government published in March 2026 describes the established Dutch practice as disconnection within two seconds when 253 V is exceeded. Details of the installed protection profile, settings and device can differ by installation. [1][2]
This is a safety mechanism. Equipment in your home and neighbouring homes, not just the inverter, must be protected against unacceptable voltages.
2.1 An important distinction: two seconds versus ten minutes
An inverter’s disconnection protection and the voltage-quality standard for a grid connection are different matters.
- Inverter protection: monitors voltage at or near the AC terminals and can respond quickly to overvoltage. The cited study describes a protection response within two seconds when 253 V is exceeded.
- Grid operator’s voltage quality: is assessed, among other things, using measurements and time averages at the point of connection. Ten-minute averages are among the values used for grid quality under the applicable standards and grid-code framework.
A Home Assistant sensor that reports voltage only once a minute is therefore not sufficient to determine independently whether the two-second protection operated correctly. It can still be useful for showing the trend.
Do not do this: do not raise the upper limit to 255, 260 or 265 V, or select another country’s profile to bypass protection. Liander explicitly states that this is unsafe and does not comply with the Dutch Electricity Grid Code. [2]
3. Why does it usually happen on sunny afternoons?
Shutdowns are most likely when many solar arrays produce at the same time while local electricity use is relatively low. Production can be particularly high in spring while heating and other substantial loads are off.
Dozens of homes on one street can export at once. Their combined export current raises voltage along parts of the low-voltage grid. Homes with a long service connection, high grid impedance or an unfavourable phase distribution may be affected sooner.
The layout of your own system also matters. An attic inverter connected to the distribution board by a long AC cable may be more prone to shutting down than the same inverter close to the board at the same grid voltage.
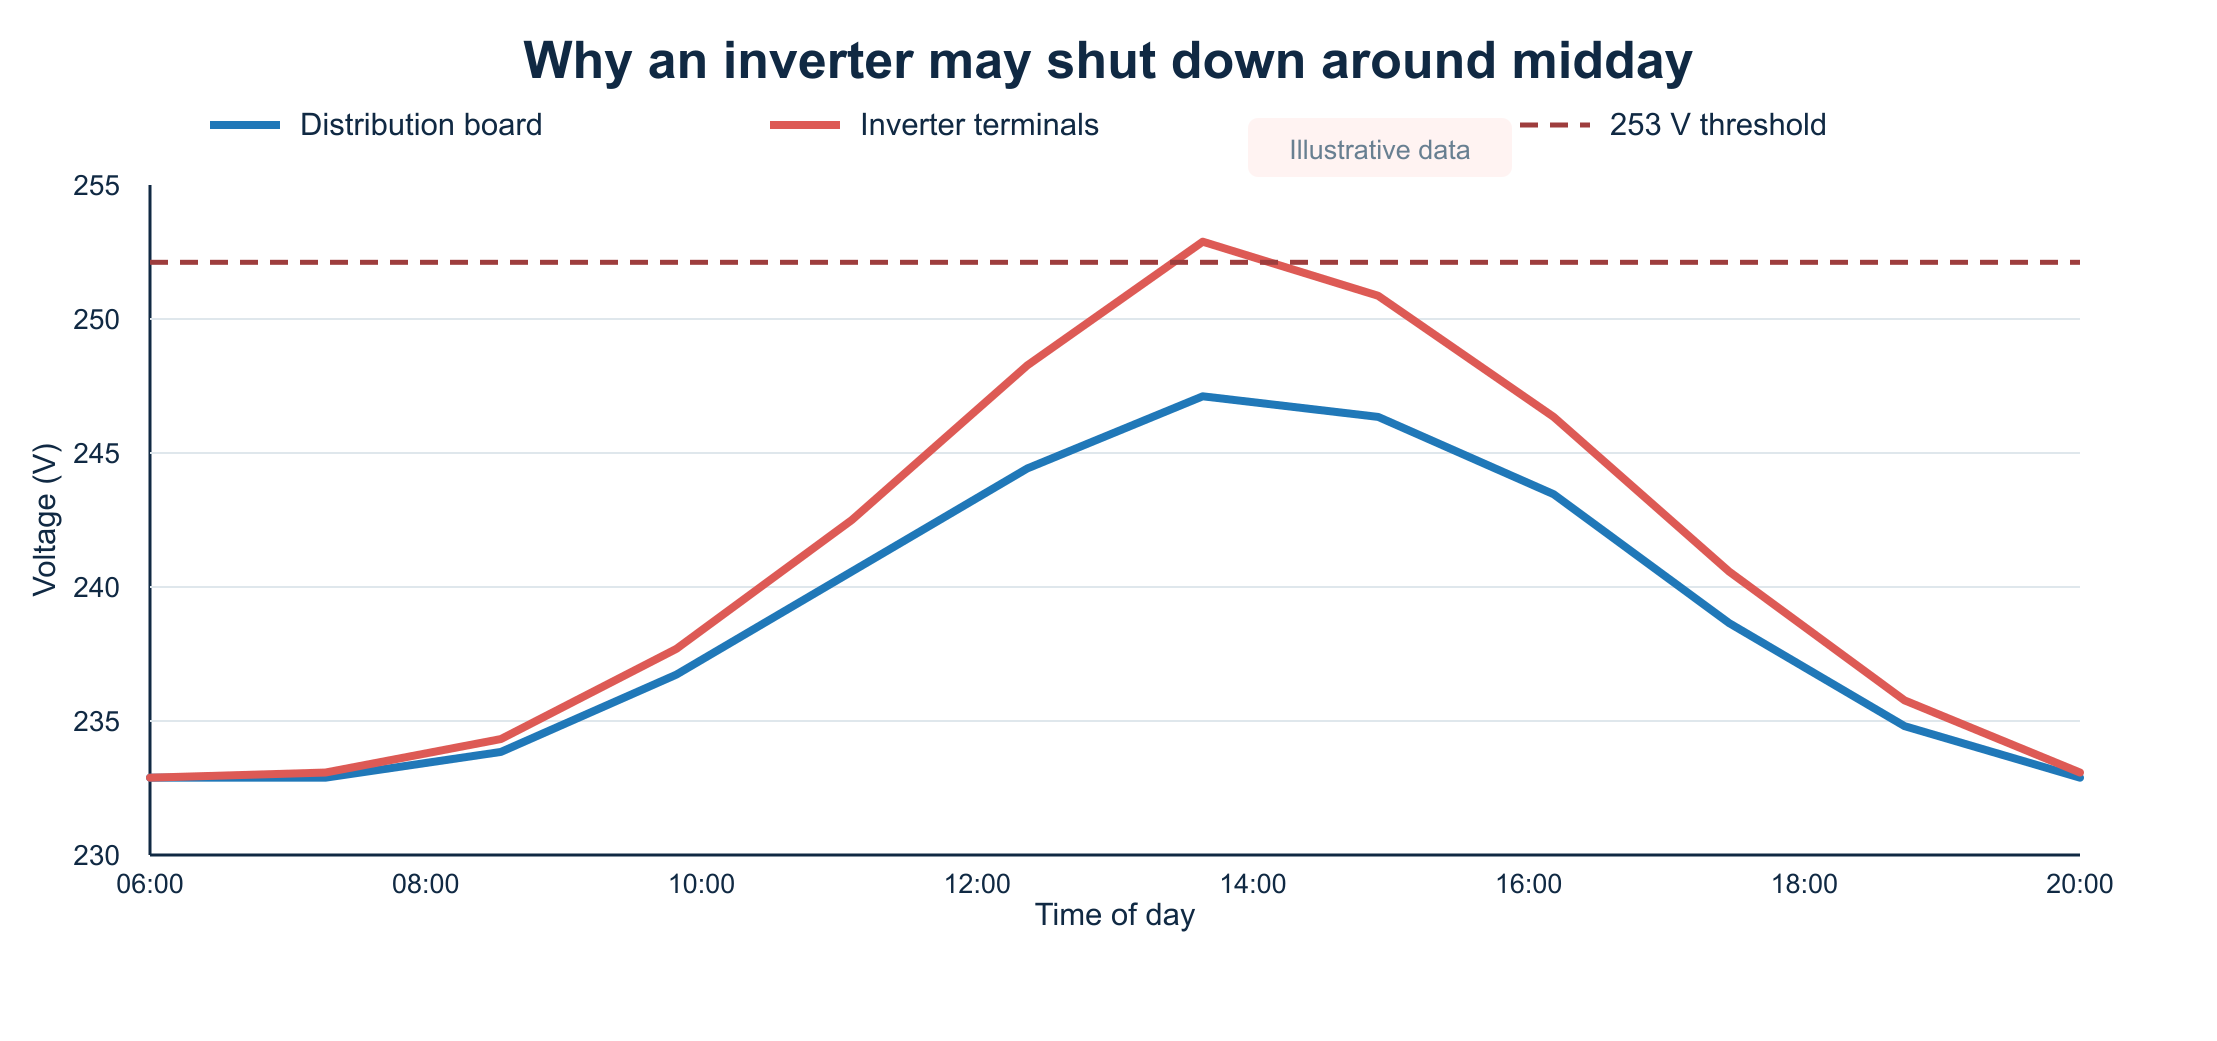
The graph illustrates three things: voltage at the distribution board rises due to conditions on the grid; voltage at the inverter rises further because of the home’s own AC circuit; and PV production may cease when the protection threshold is reached.
4. The physics: voltage rises along a cable
For a simple, nearly resistive single-phase calculation, start with Ohm’s law:
ΔU ≈ I × R
Here ΔU is the voltage difference in volts, I is current in amperes and R is the relevant electrical resistance in ohms. In a two-wire single-phase circuit, current travels through the phase and neutral conductors. Both contribute to the loop resistance.
For a copper cable, an approximation at 20 °C is:
R_loop ≈ 2 × L × ρ / A
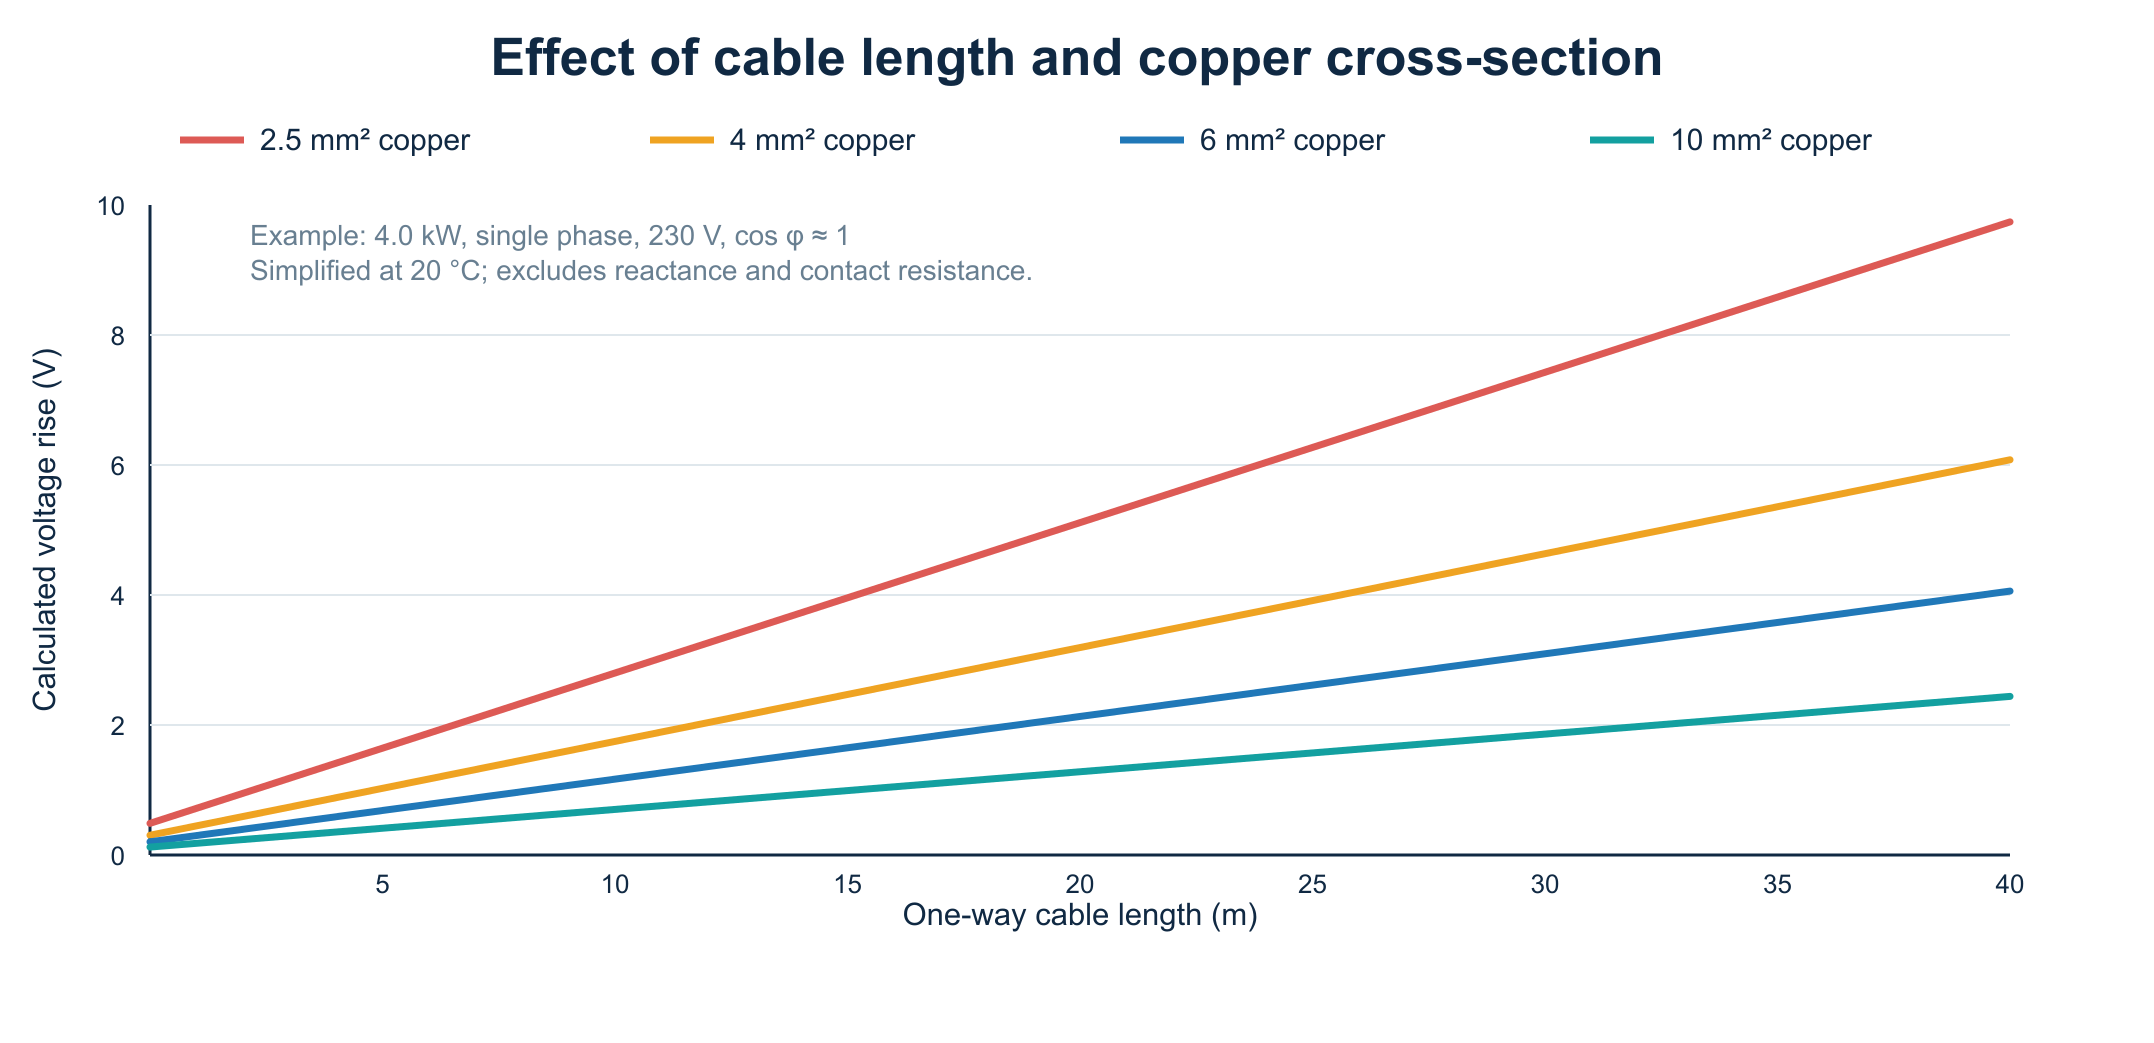
Here L is the one-way cable length (m), ρ ≈ 0.0175 Ω·mm²/m for copper at 20 °C and A is the copper cross-section (mm²). The factor of two represents the phase and neutral conductors. This is a simplification: actual cable temperature, power factor, inductive reactance, connections and the particular supply system affect the result.
4.1 Example: a 4 kW inverter and 20 metres of cable
Suppose a single-phase inverter delivers 4,000 W at approximately 230 V and a power factor near 1. The current is then:
I ≈ 4,000 / 230 = 17.4 A.
With 20 metres of 2.5 mm² copper cable, the approximate outward-and-return resistance is:
R_loop ≈ 2 × 20 × 0.0175 / 2.5 = 0.28 Ω.
The corresponding voltage rise is:
ΔU ≈ 17.4 × 0.28 = 4.9 V.
If the distribution board measures 248.0 V during production, the inverter in this highly simplified example may see approximately 252.9 V. The board remains below 253 V while the inverter nearly reaches the limit.
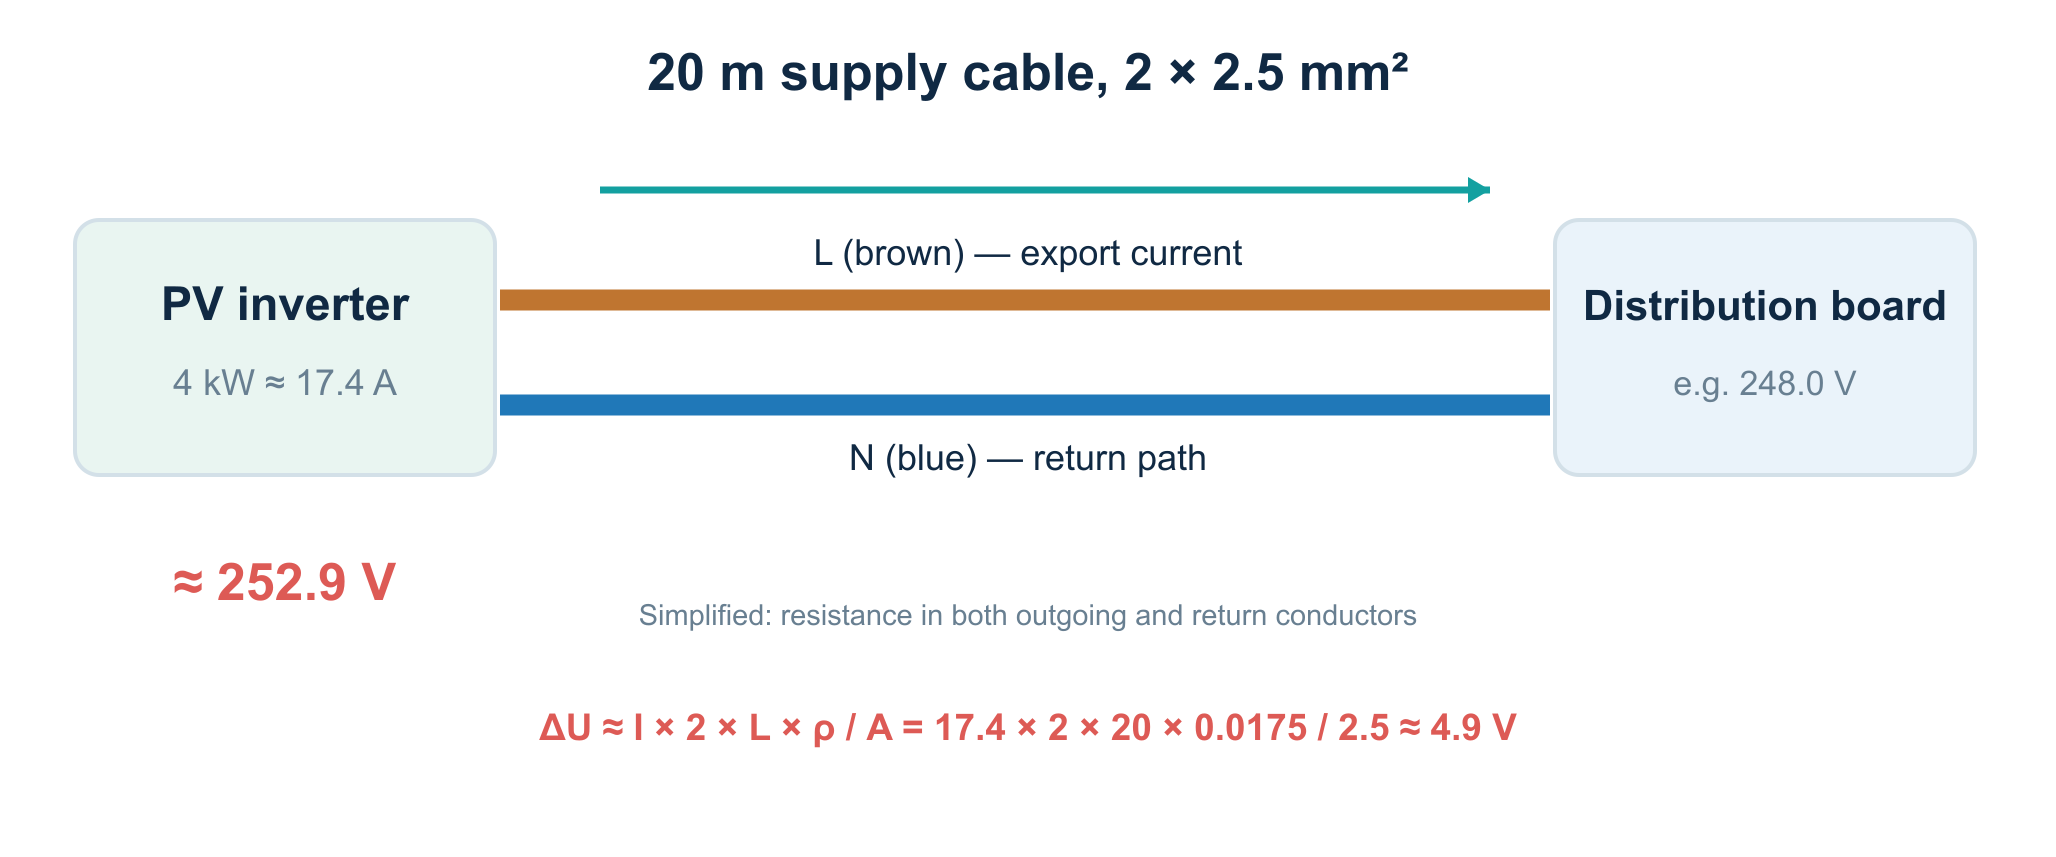
This worked example is not cable-sizing advice. At 4 kW and 2.5 mm², a competent installer must establish suitability for the complete installation, including installation method, thermal loading, protection, manufacturer instructions and NEN 1010. A calculated voltage rise alone says nothing about whether the installation is permissible.
4.2 What changes with a thicker cable?
Under exactly the same theoretical assumptions (20 m, 17.4 A, copper at 20 °C), the approximate figures are:
| Cross-section | Approximate loop resistance | Approximate voltage rise |
|---|---|---|
| 2.5 mm² | 0.280 Ω | 4.87 V |
| 4 mm² | 0.175 Ω | 3.04 V |
| 6 mm² | 0.117 Ω | 2.03 V |
| 10 mm² | 0.070 Ω | 1.22 V |
A larger cross-section reduces the impedance of your own AC circuit. If voltage at the point of connection is already too high, changing a cable cannot solve that external problem. Replacing a cable is useful only when the diagnosis shows that the home’s own circuit makes a meaningful contribution.
4.3 Why temperature and connections matter
Copper’s resistance increases as temperature rises. A cable that remains warm for a long period may therefore cause a larger voltage difference than the 20 °C model predicts. Loose, oxidised or improperly finished connections can also add contact resistance. Besides affecting measurement, this can produce local heating and a fire hazard.
When investigating, an installer checks the cable route, conductor cross-section, connections, components, loading and temperature development, among other things. Readers should not remove distribution-board covers or take live measurements themselves.
5. What is the difference between single-phase and three-phase inverters?
With a single-phase inverter, the entire AC current normally flows through one phase and its neutral. A three-phase inverter spreads a comparable total output much more evenly across L1, L2 and L3, provided it was designed and connected for that purpose.
A numerical comparison at 6 kW and 230 V per phase (power factor near 1):
- Single phase: 6,000 / 230 ≈ 26.1 A on one phase.
- Three phases, evenly distributed: 2,000 / 230 ≈ 8.7 A per phase.
That difference can reduce voltage rise in the home’s own phase conductor. At the same time, actual grid voltage depends on the impedance and loading of each phase in the street. A three-phase connection does not make the problem impossible.
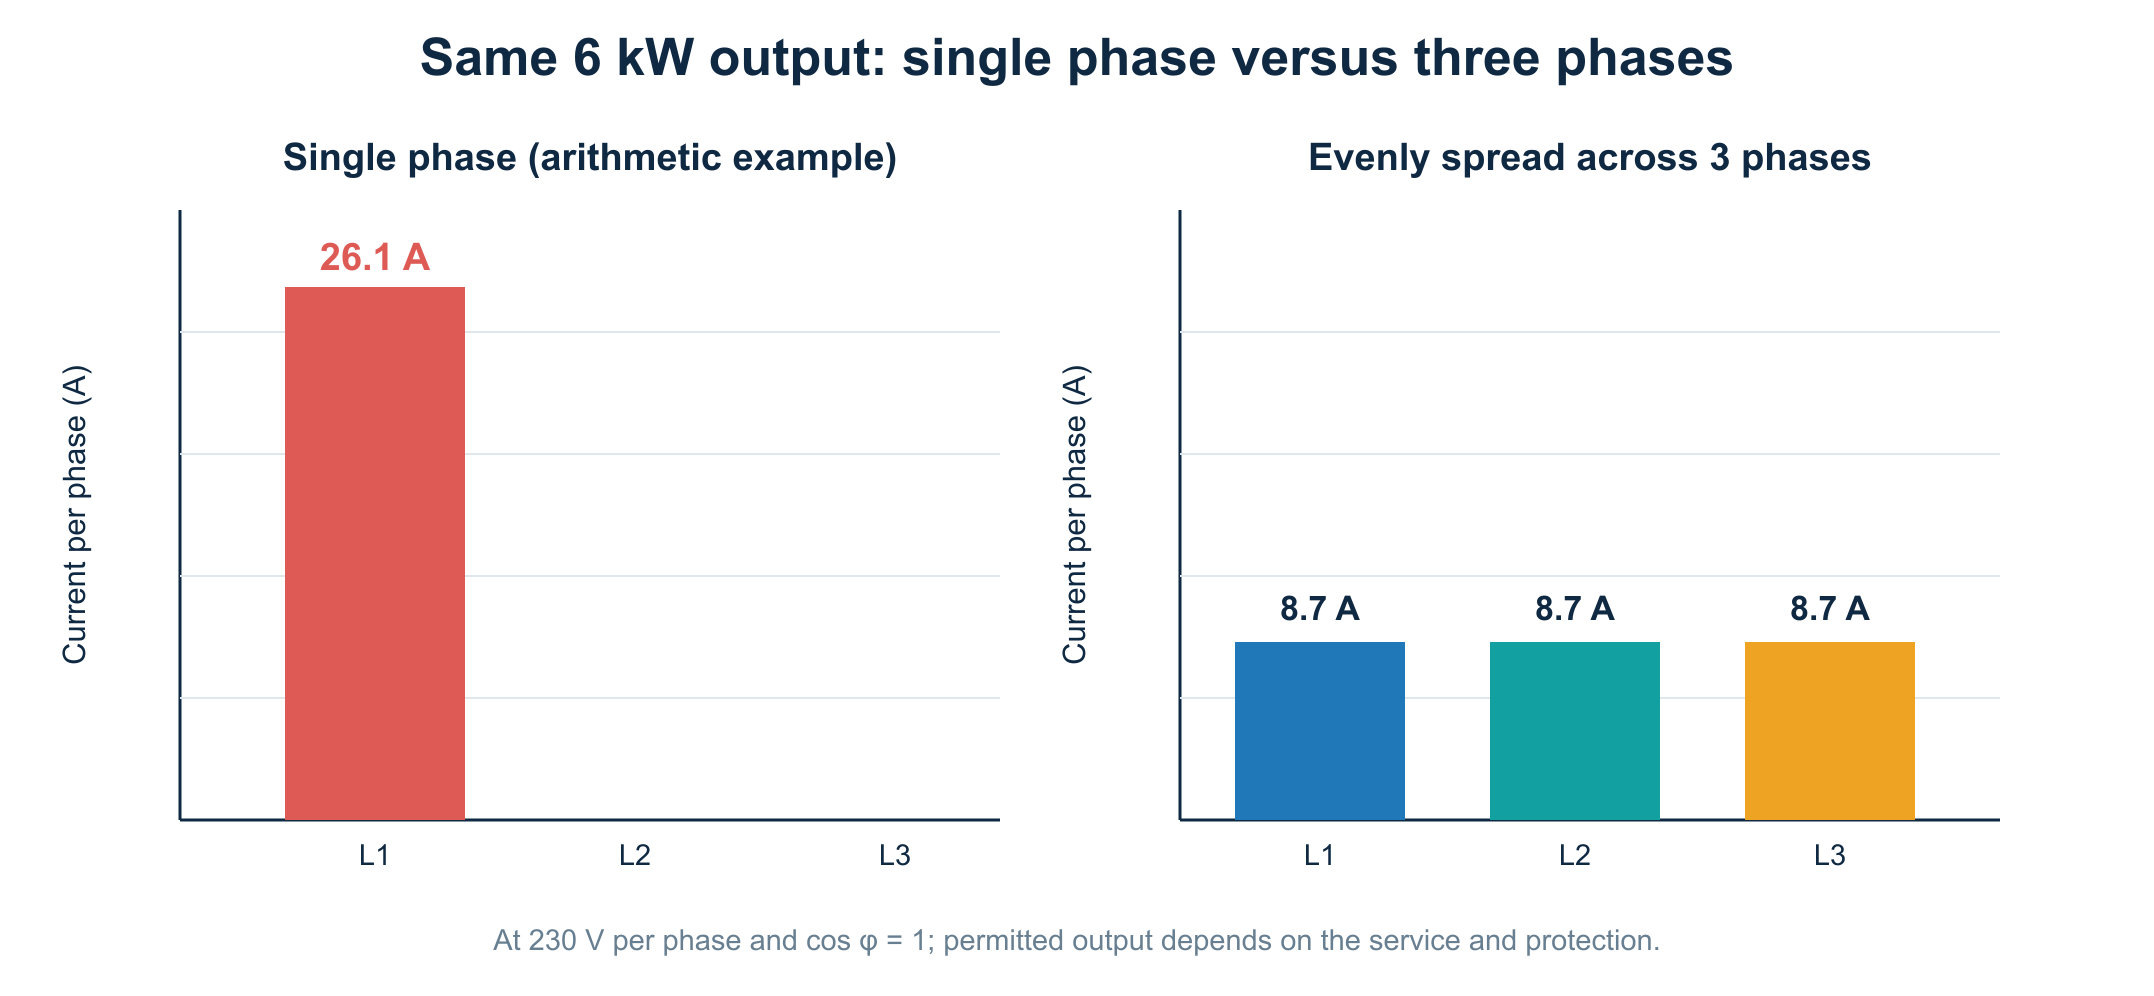
Note: the 6 kW single-phase inverter here is only a numerical comparison. It is explicitly not a proposal to connect one to a 3 × 25 A service; permitted feed-in and protection require a suitable design.
6. Why do only some microinverters sometimes shut down?
In a string-inverter system, conversion from DC to AC takes place at one central location. Many string systems shut down completely on overvoltage. With microinverters, the AC outputs are distributed across the roof and connected by an AC cable network.
Each microinverter measures its own electrical conditions. Voltage can rise across successive AC cable segments, depending on the current in each one. Consequently, microinverters electrically farther from the distribution board may see a higher AC voltage in some designs.
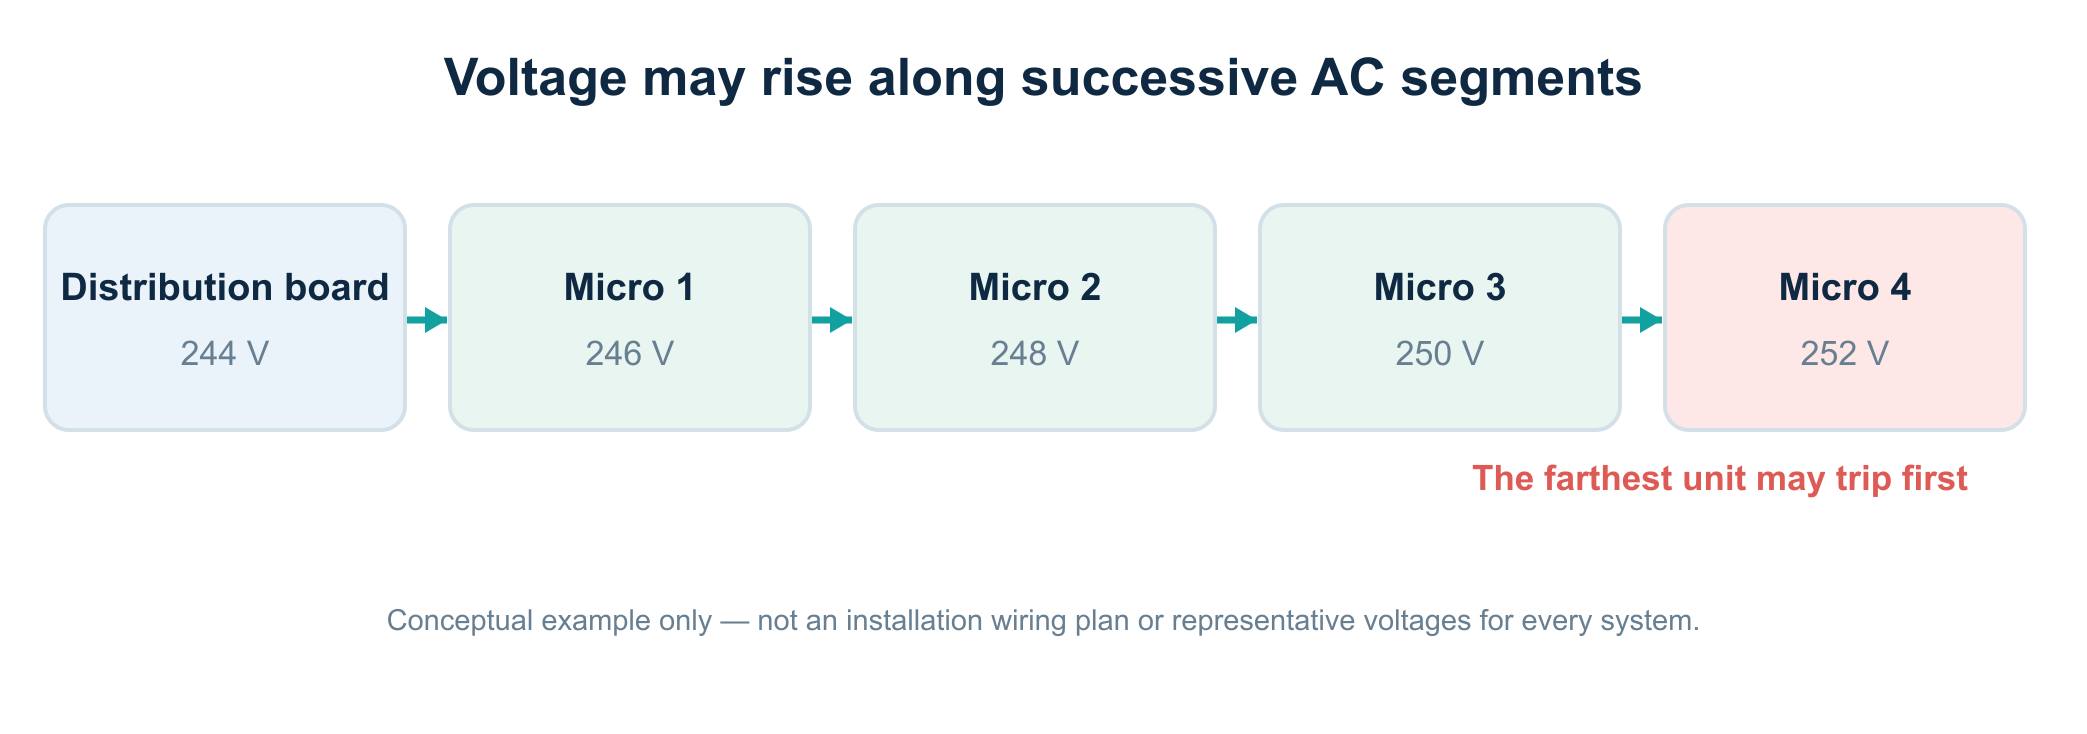
The Dutch-government study published in March 2026 explicitly describes microinverters at the end of the AC cabling often shutting down first. When one unit stops, cable current changes and the voltage difference can decrease. Other microinverters may keep producing. [1]
For owners of systems such as APsystems, Enphase and other microinverter platforms, the conclusion matters: a partial drop in production can result from grid voltage without all microinverters stopping together. First check their actual error messages and the real AC layout; shading, temperature, communications or a defect can also reduce output.
6.1 Microinverters are not inherently worse
Microinverters offer other advantages, such as module-level monitoring and separate MPPT points. The important factors for voltage rise are not the brand or the word micro, but the combination of current, cable impedance, phase distribution, wiring topology and local grid voltage.
A good design therefore accounts for the AC bus and the position of individual microinverters, not just the panels and expected yield.
7. What is the difference between grid congestion and voltage problems?
These terms are often used interchangeably, but they are not the same.
Grid congestion concerns limits on transporting electricity through the grid, for example thermal capacity or network constraints. Voltage problems mean voltage quality at a particular location is insufficient or at risk of becoming so. The two can be connected: extensive export may both use transport capacity and cause a local rise in voltage.
An inverter shutting down at 253 V does not, by itself, prove that the neighbourhood transformer is thermally overloaded. Nor does it prove that the grid operator caused the problem: much of the extra voltage may arise in your own AC cable.
To tell the difference, you need measurements at the right points.
8. Why does the inverter keep switching off and on?
Solar generation can create a typical cycling pattern:
- The sun shines and PV output increases.
- Export raises the voltage at the AC terminals.
- Protection operates and the inverter stops exporting.
- Export current falls, so the voltage rise also diminishes.
- After a permitted restart procedure, the inverter begins producing again.
- If conditions remain the same, the cycle repeats.
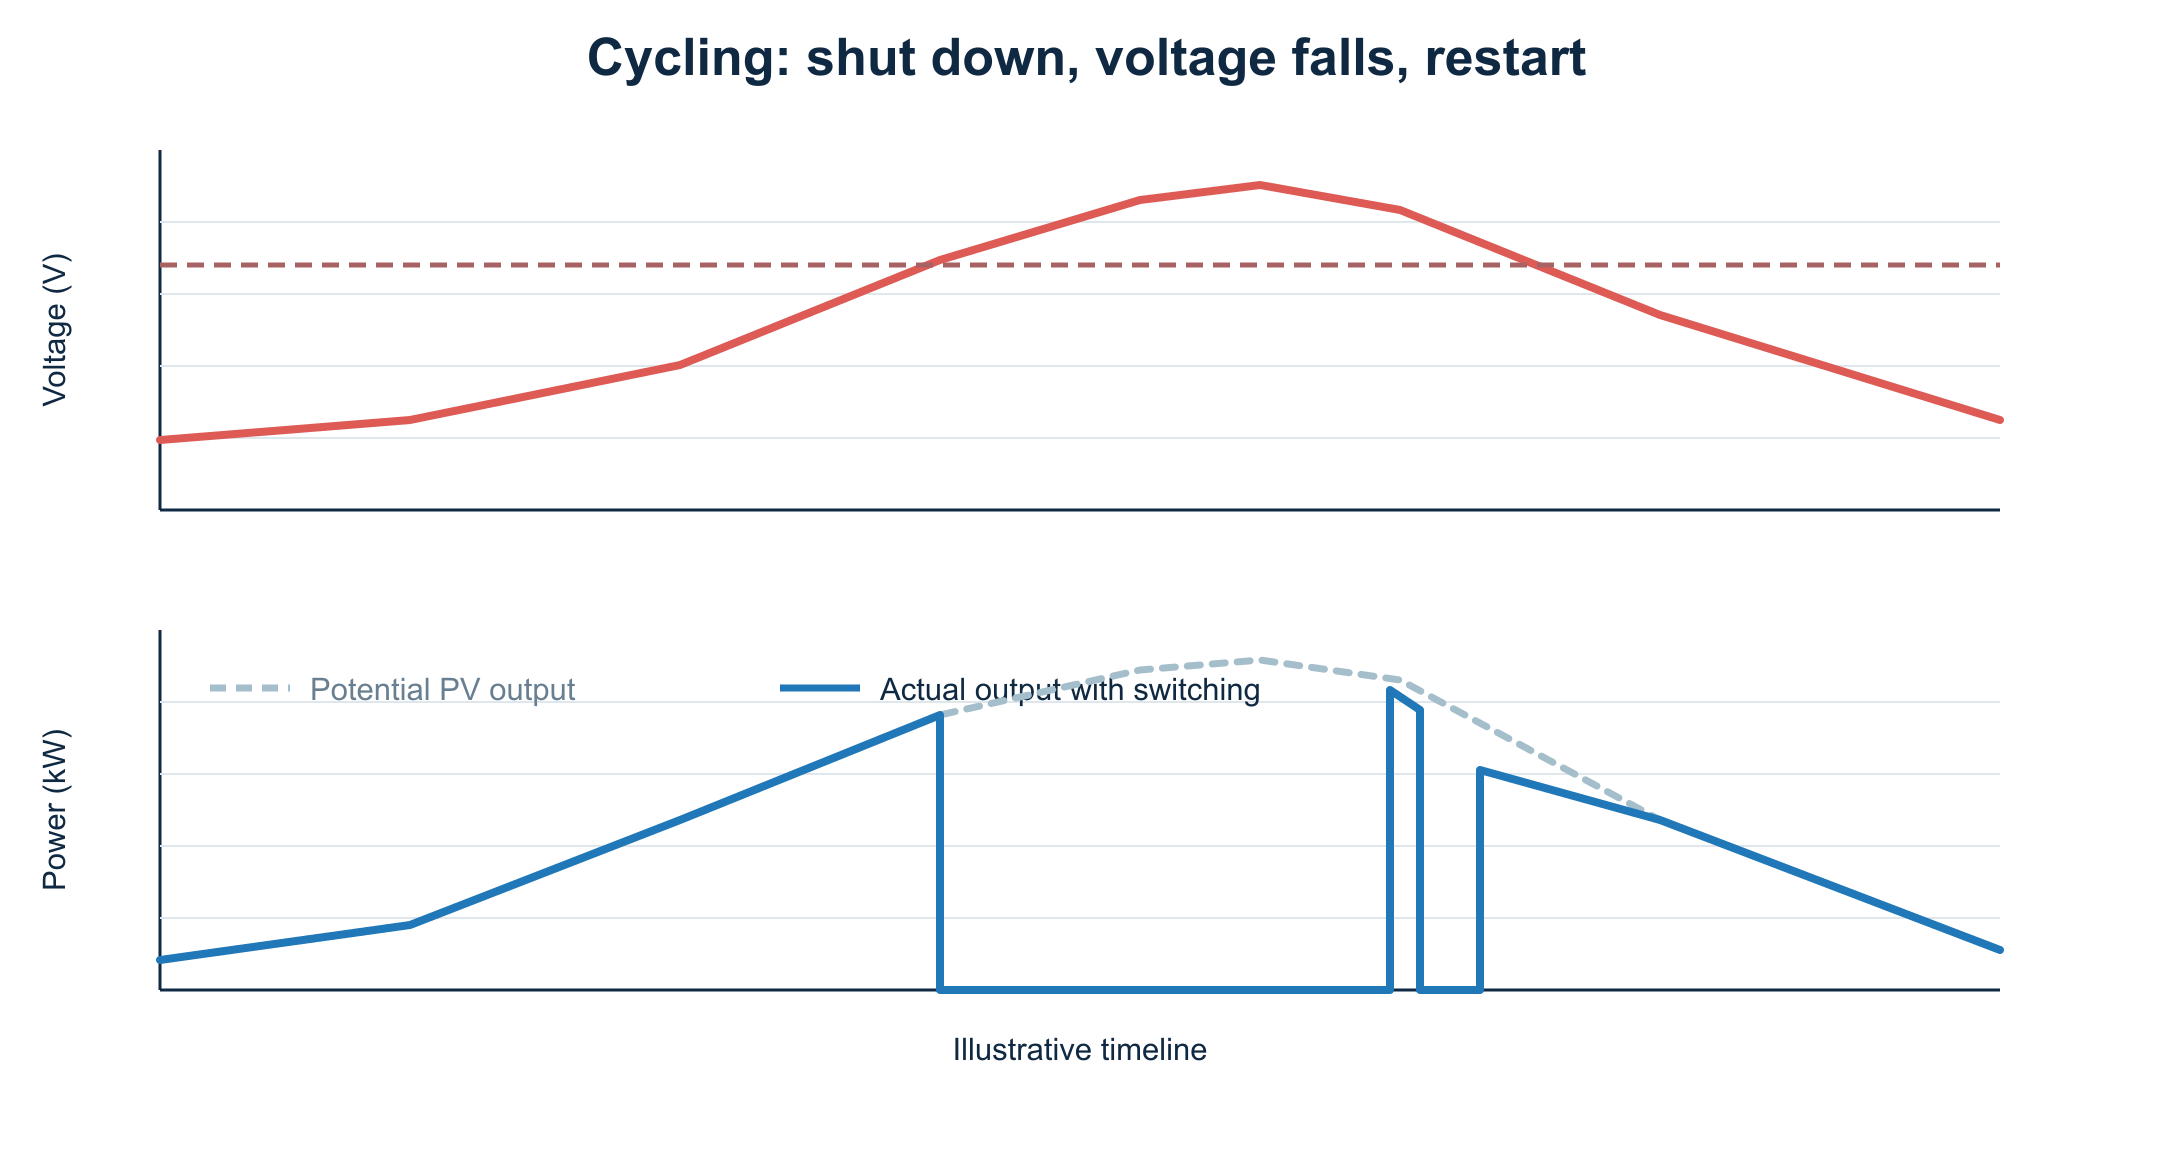
Restart times and protection functions differ by device and standards setting. This can appear as dozens of short dips on a production graph or as longer periods without production.
Repeated switching under load may also stress components. The Dutch study identifies loaded switching of internal relays in particular as a concern. [1]
9. Recognise the symptoms, but do not jump to a conclusion
An inverter that shuts down in strong sunshine may be affected by high AC voltage. The shape of a production graph alone is not enough for a diagnosis.
| Observation | Possible explanation | What to check |
|---|---|---|
| Output stops around midday | High grid voltage or thermal limiting | AC voltage and error message |
| One or a few microinverters stop | Different AC voltage, wiring or individual fault | Logs for each microinverter |
| All inverters stop at once | Shared AC or grid fault | AC voltage, fuse/breaker, gateway, network |
| Output falls gradually | Cloud, temperature or active power control | Power curve and inverter status |
| Inverter reports a fault at night | A problem other than PV-related voltage rise | Manufacturer’s message, installer |
| Lights flicker and equipment malfunctions | Possible general voltage or neutral problem | Fault service if symptoms are serious |
Frequent flickering, unusually bright lamps or faults in several appliances should not be attributed to PV alone. A poor neutral connection or another installation fault can present a much more serious risk.
Safety warning: do you suspect a loose neutral, burning smell, sparks, hot connections or large voltage fluctuations in the home? Stop experimenting and call a competent electrician. For an acute grid-related fault in the Netherlands, the national fault number 0800-9009 is relevant. Do not touch an open distribution board, AC terminals or inverter connectors.
10. How do you find where voltage becomes too high?
A useful diagnosis preferably compares three locations:
A. At the inverter. This is the location relevant to overvoltage protection. Where possible, use the manufacturer’s voltage measurement and event log. Pay attention to measurement interval and resolution.
B. At the distribution board. A suitable and properly installed energy meter can record phase-to-neutral voltage in the installation. This helps estimate the difference along the PV circuit.
C. At the point of connection. Some smart meters provide voltage per phase through P1 data. Not all meters, firmware versions or integrations expose these values. A P1 meter cannot replace a calibrated voltage-quality assessment by the grid operator.
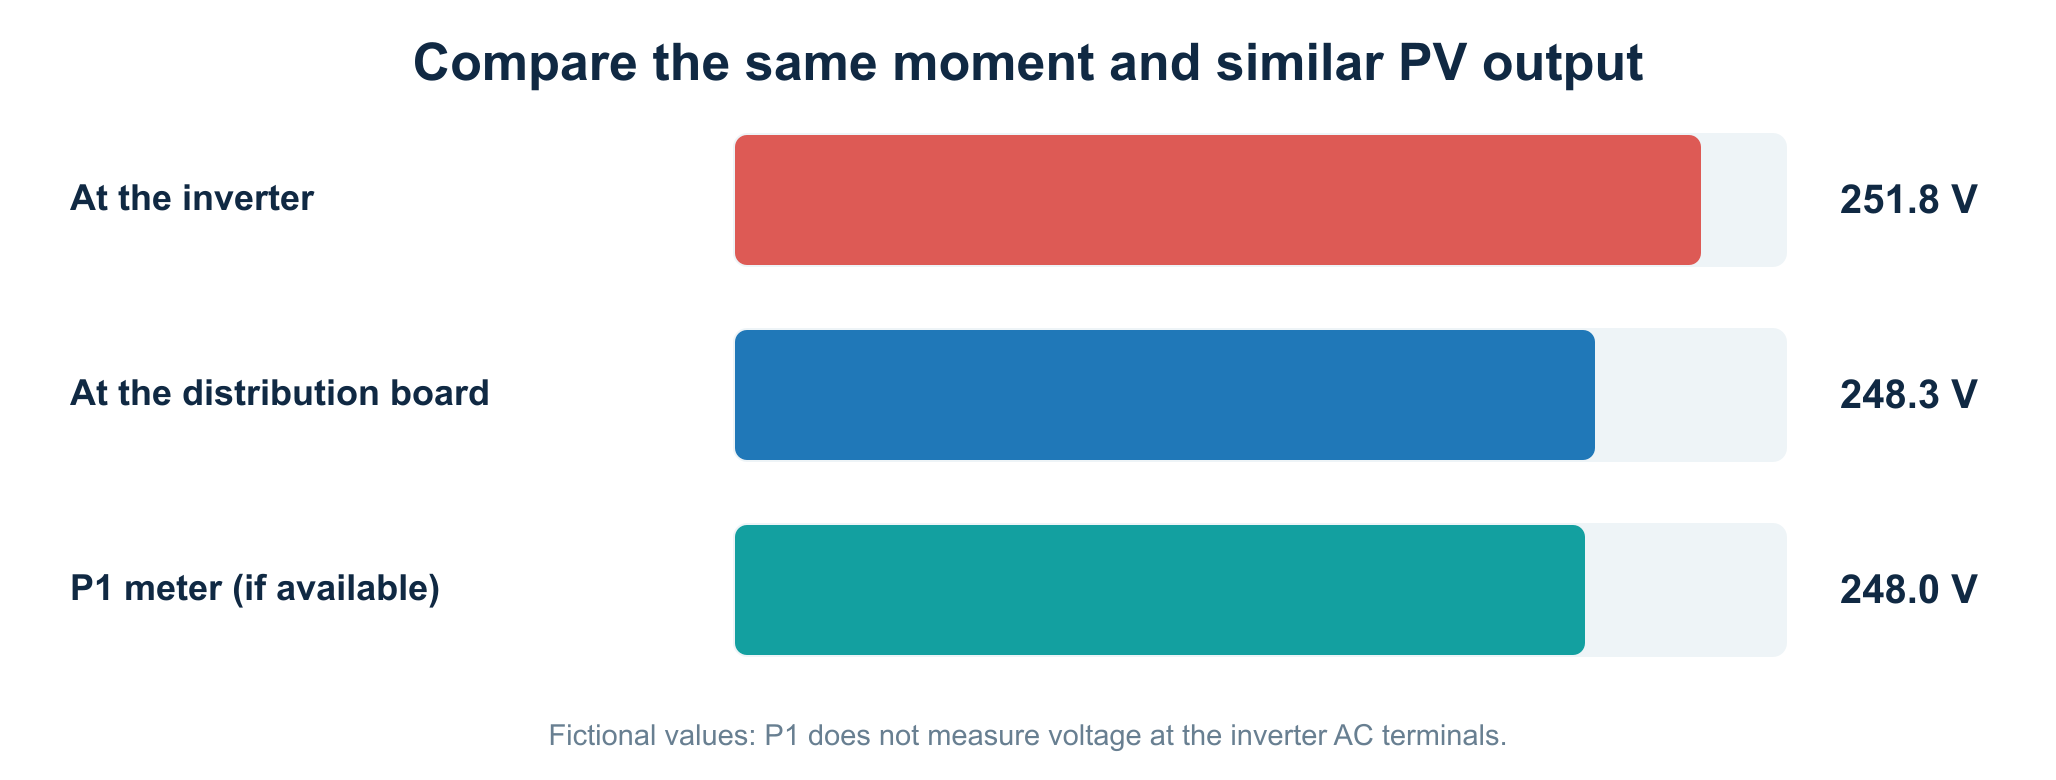
In this fictional example, the difference between inverter and distribution board is 3.5 V. This supports the hypothesis that the home’s own AC circuit contributes substantially to voltage rise. One snapshot does not show whether the difference is normal for the cable or caused by a poor connection.
10.1 Measure as simultaneously as possible
A measurement of 248 V at the distribution board at 12:30 and 252 V at the inverter at 12:38 is not a clean comparison. PV output, clouds and neighbourhood demand can change considerably in eight minutes. Record the same time, same phase and simultaneous output as closely as possible.
Ideally, collect data over several sunny days. A recorded peak is different from sustained elevated voltage. Record it even when the inverter does not show an error code.
10.2 Which meters are useful?
- Inverter or ECU portal: the first source for its voltage reading and error codes. A gateway may summarise values and is not a laboratory instrument.
- P1 monitoring: useful for trends at or near the smart meter, provided the necessary voltage readings are actually available.
- DIN-rail energy meter (for example Modbus or a suitable Shelly): can offer a more frequent local measurement point. Consider accuracy, sample interval, phase mapping and installation instructions.
- Professional mains-voltage logger or power-quality analyser: needed when assessing short peaks, harmonics, time averages, voltage imbalance or formal compliance with standards.
A software dashboard is useful for trend analysis, but provides no safety function and does not automatically produce legally useful evidence.
11. Phases: why L2 in particular may cause trouble
The phases in a neighbourhood do not always carry precisely equal loads or receive equal solar input. L2 may, for example, measure 251 V while L1 reads 244 V and L3 reads 247 V.
That can seem odd on a three-phase connection, but each phase has its own load and feed-in pattern. The neutral conductor and the grid upstream of the home also influence the individual phase-to-neutral voltages.
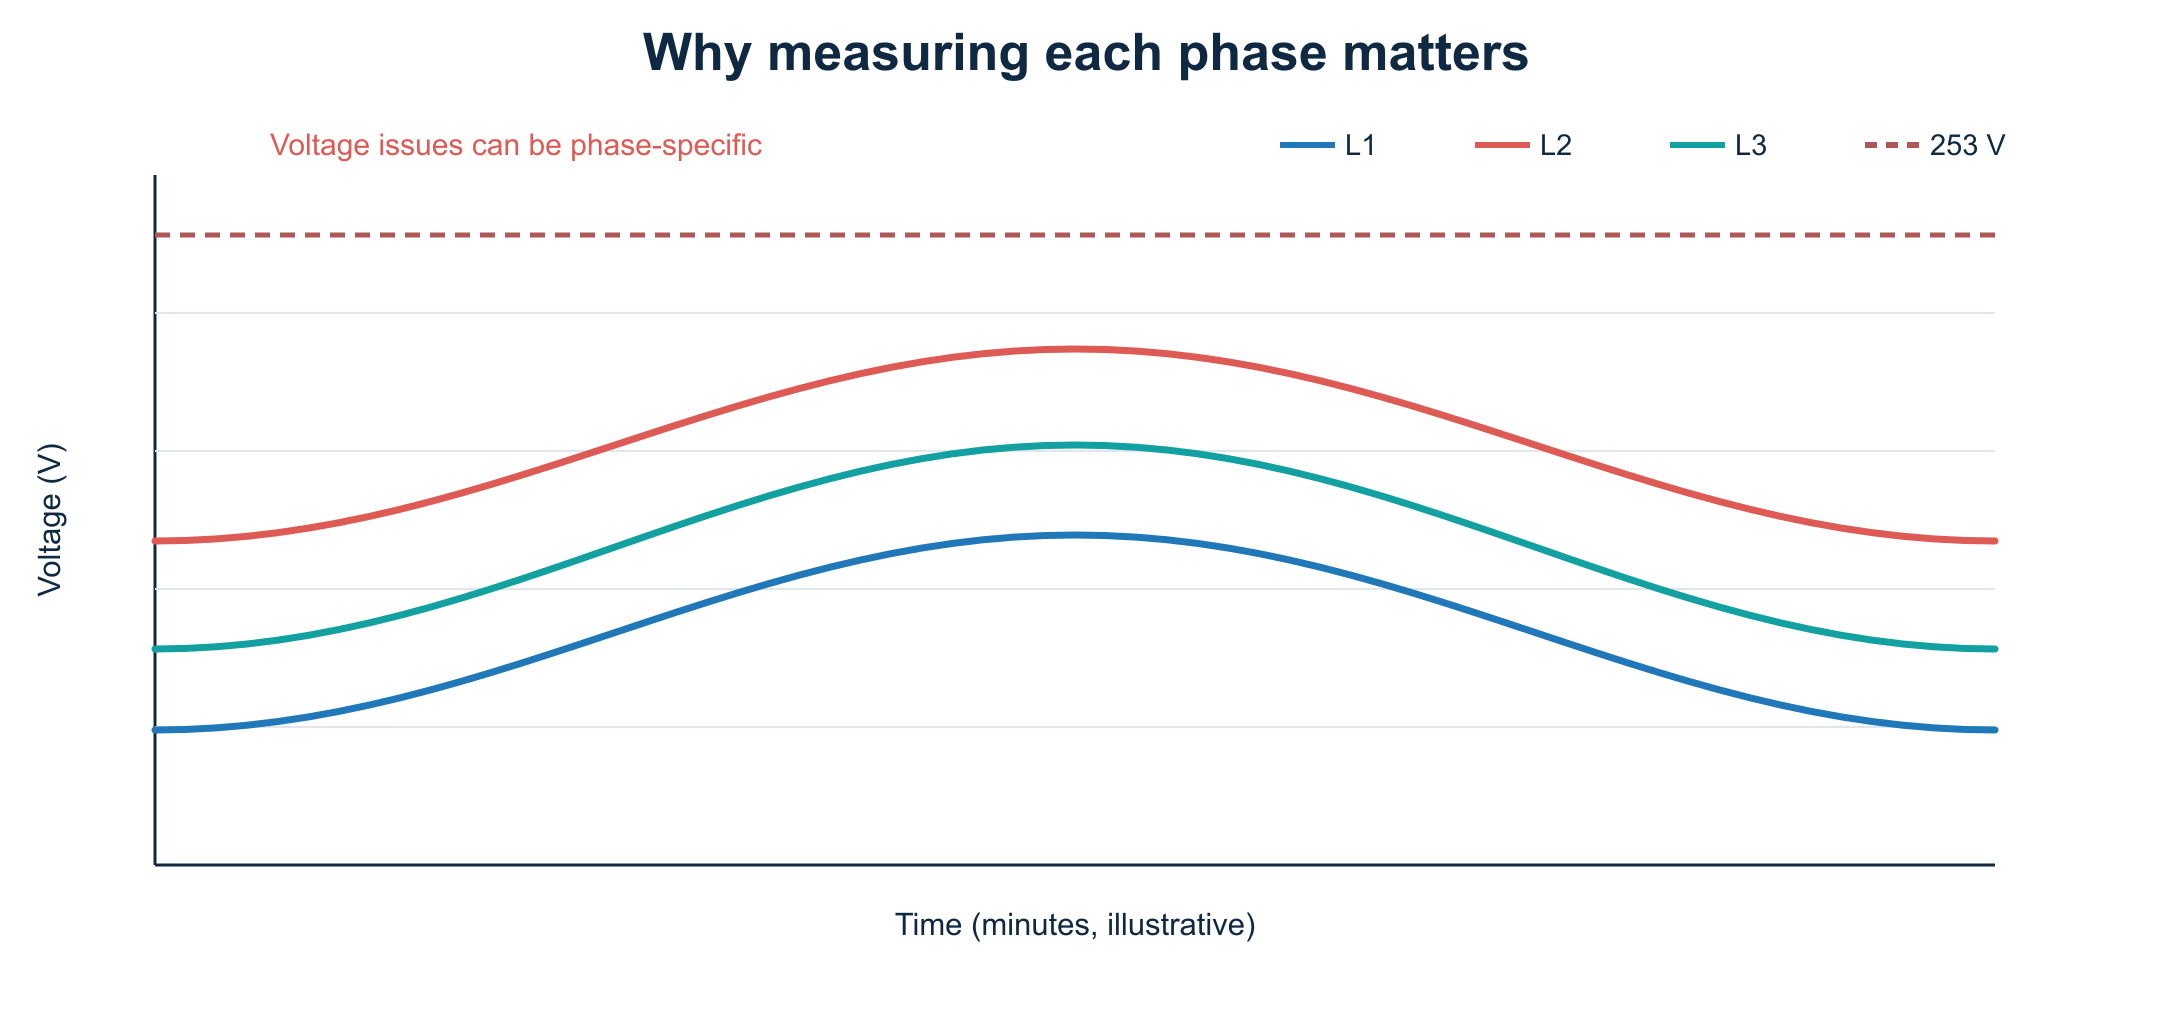
For a single-phase inverter, it is therefore useful to establish which phase it is actually connected to. Reassigning a PV connection can help in some installations, but it is never a generic DIY fix. An installer must assess the load, protection and actual phase distribution, among other things.
Monitoring each phase remains relevant even with three-phase inverters. Some systems stop when one involved phase exceeds a limit.
12. Practical steps for a reliable diagnosis
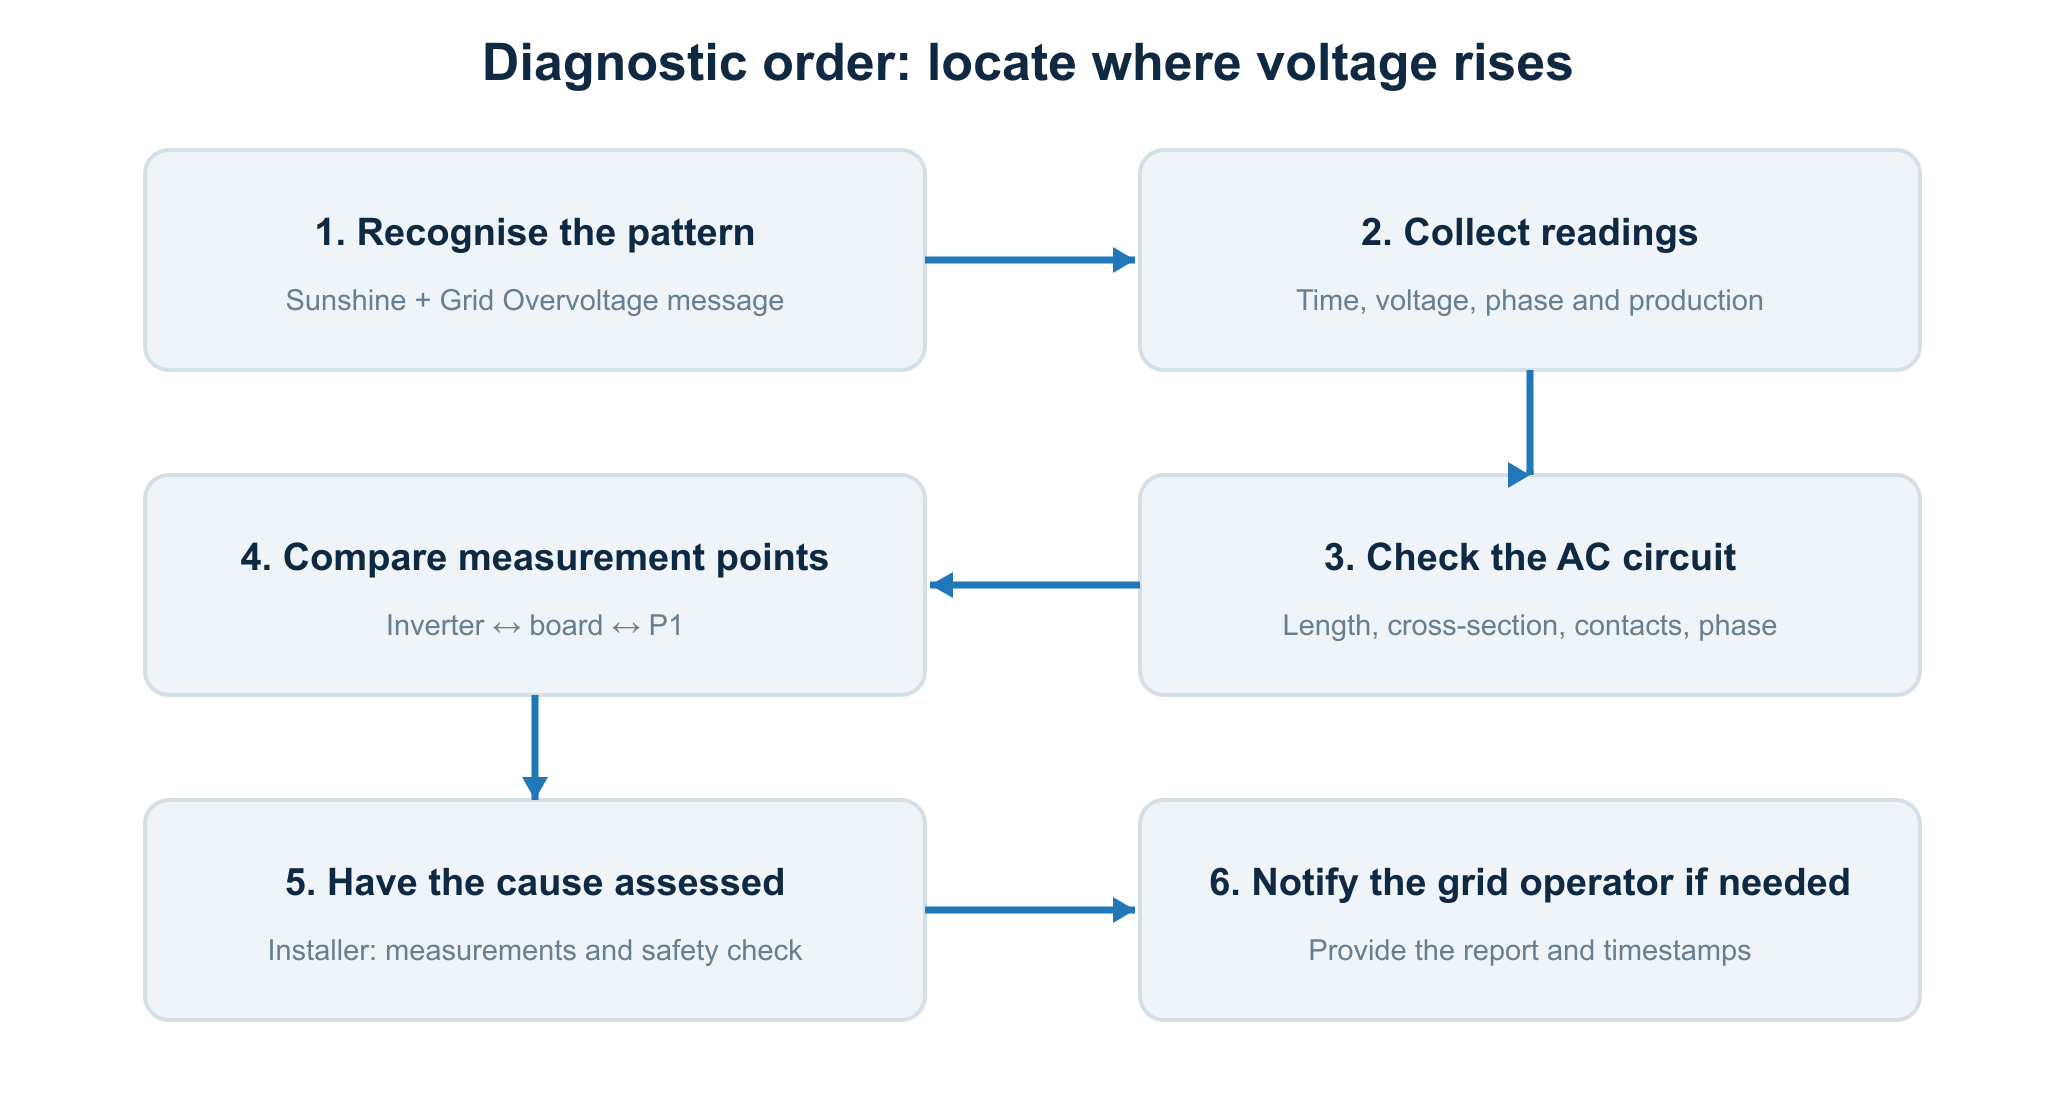
Step 1 – Check the exact fault pattern. Record the error code, date, time and reported voltage. A Grid Overvoltage message is stronger evidence than a production dip alone.
Step 2 – Log production. Save times, AC power and measured voltages where possible. With microinverters, note whether one module, one branch or the entire system stops.
Step 3 – Find available phase voltages. Check whether P1, a suitable energy meter or the inverter app provides L1/L2/L3 separately. Do not confuse phase-to-neutral voltage with 400 V line-to-line voltage.
Step 4 – Have your AC circuit assessed. Consider cable length and cross-section, connectors, protection, phase distribution and possible contact resistance. Have this done safely and in accordance with applicable installation requirements.
Step 5 – Compare simultaneous measurements. If inverter voltage is clearly higher than voltage at the distribution board, wiring in the home may contribute. If voltage at the smart meter is also persistently high, the public grid may be an important cause.
Step 6 – Notify the grid operator if necessary. Provide the installer’s findings, specific times and any measurement logs. The operator can investigate the quality of its part of the grid.
13. What can you safely do yourself?
You can gather valuable information without opening the distribution board or changing inverter settings. Check in the app whether the error codes truly point to voltage problems. Compare sunny and cloudy days and see whether other appliances also malfunction.
For two to four weeks, keep a table with date, time, voltage per phase, AC output and message. Minute-resolution data can establish context; it will not necessarily reveal the shortest overvoltage peaks.
Do not open the inverter’s AC connection, inspect an energised distribution board, move neutral conductors, choose another country code or disable overvoltage protection yourself.
14. Home Assistant: make the problem visible
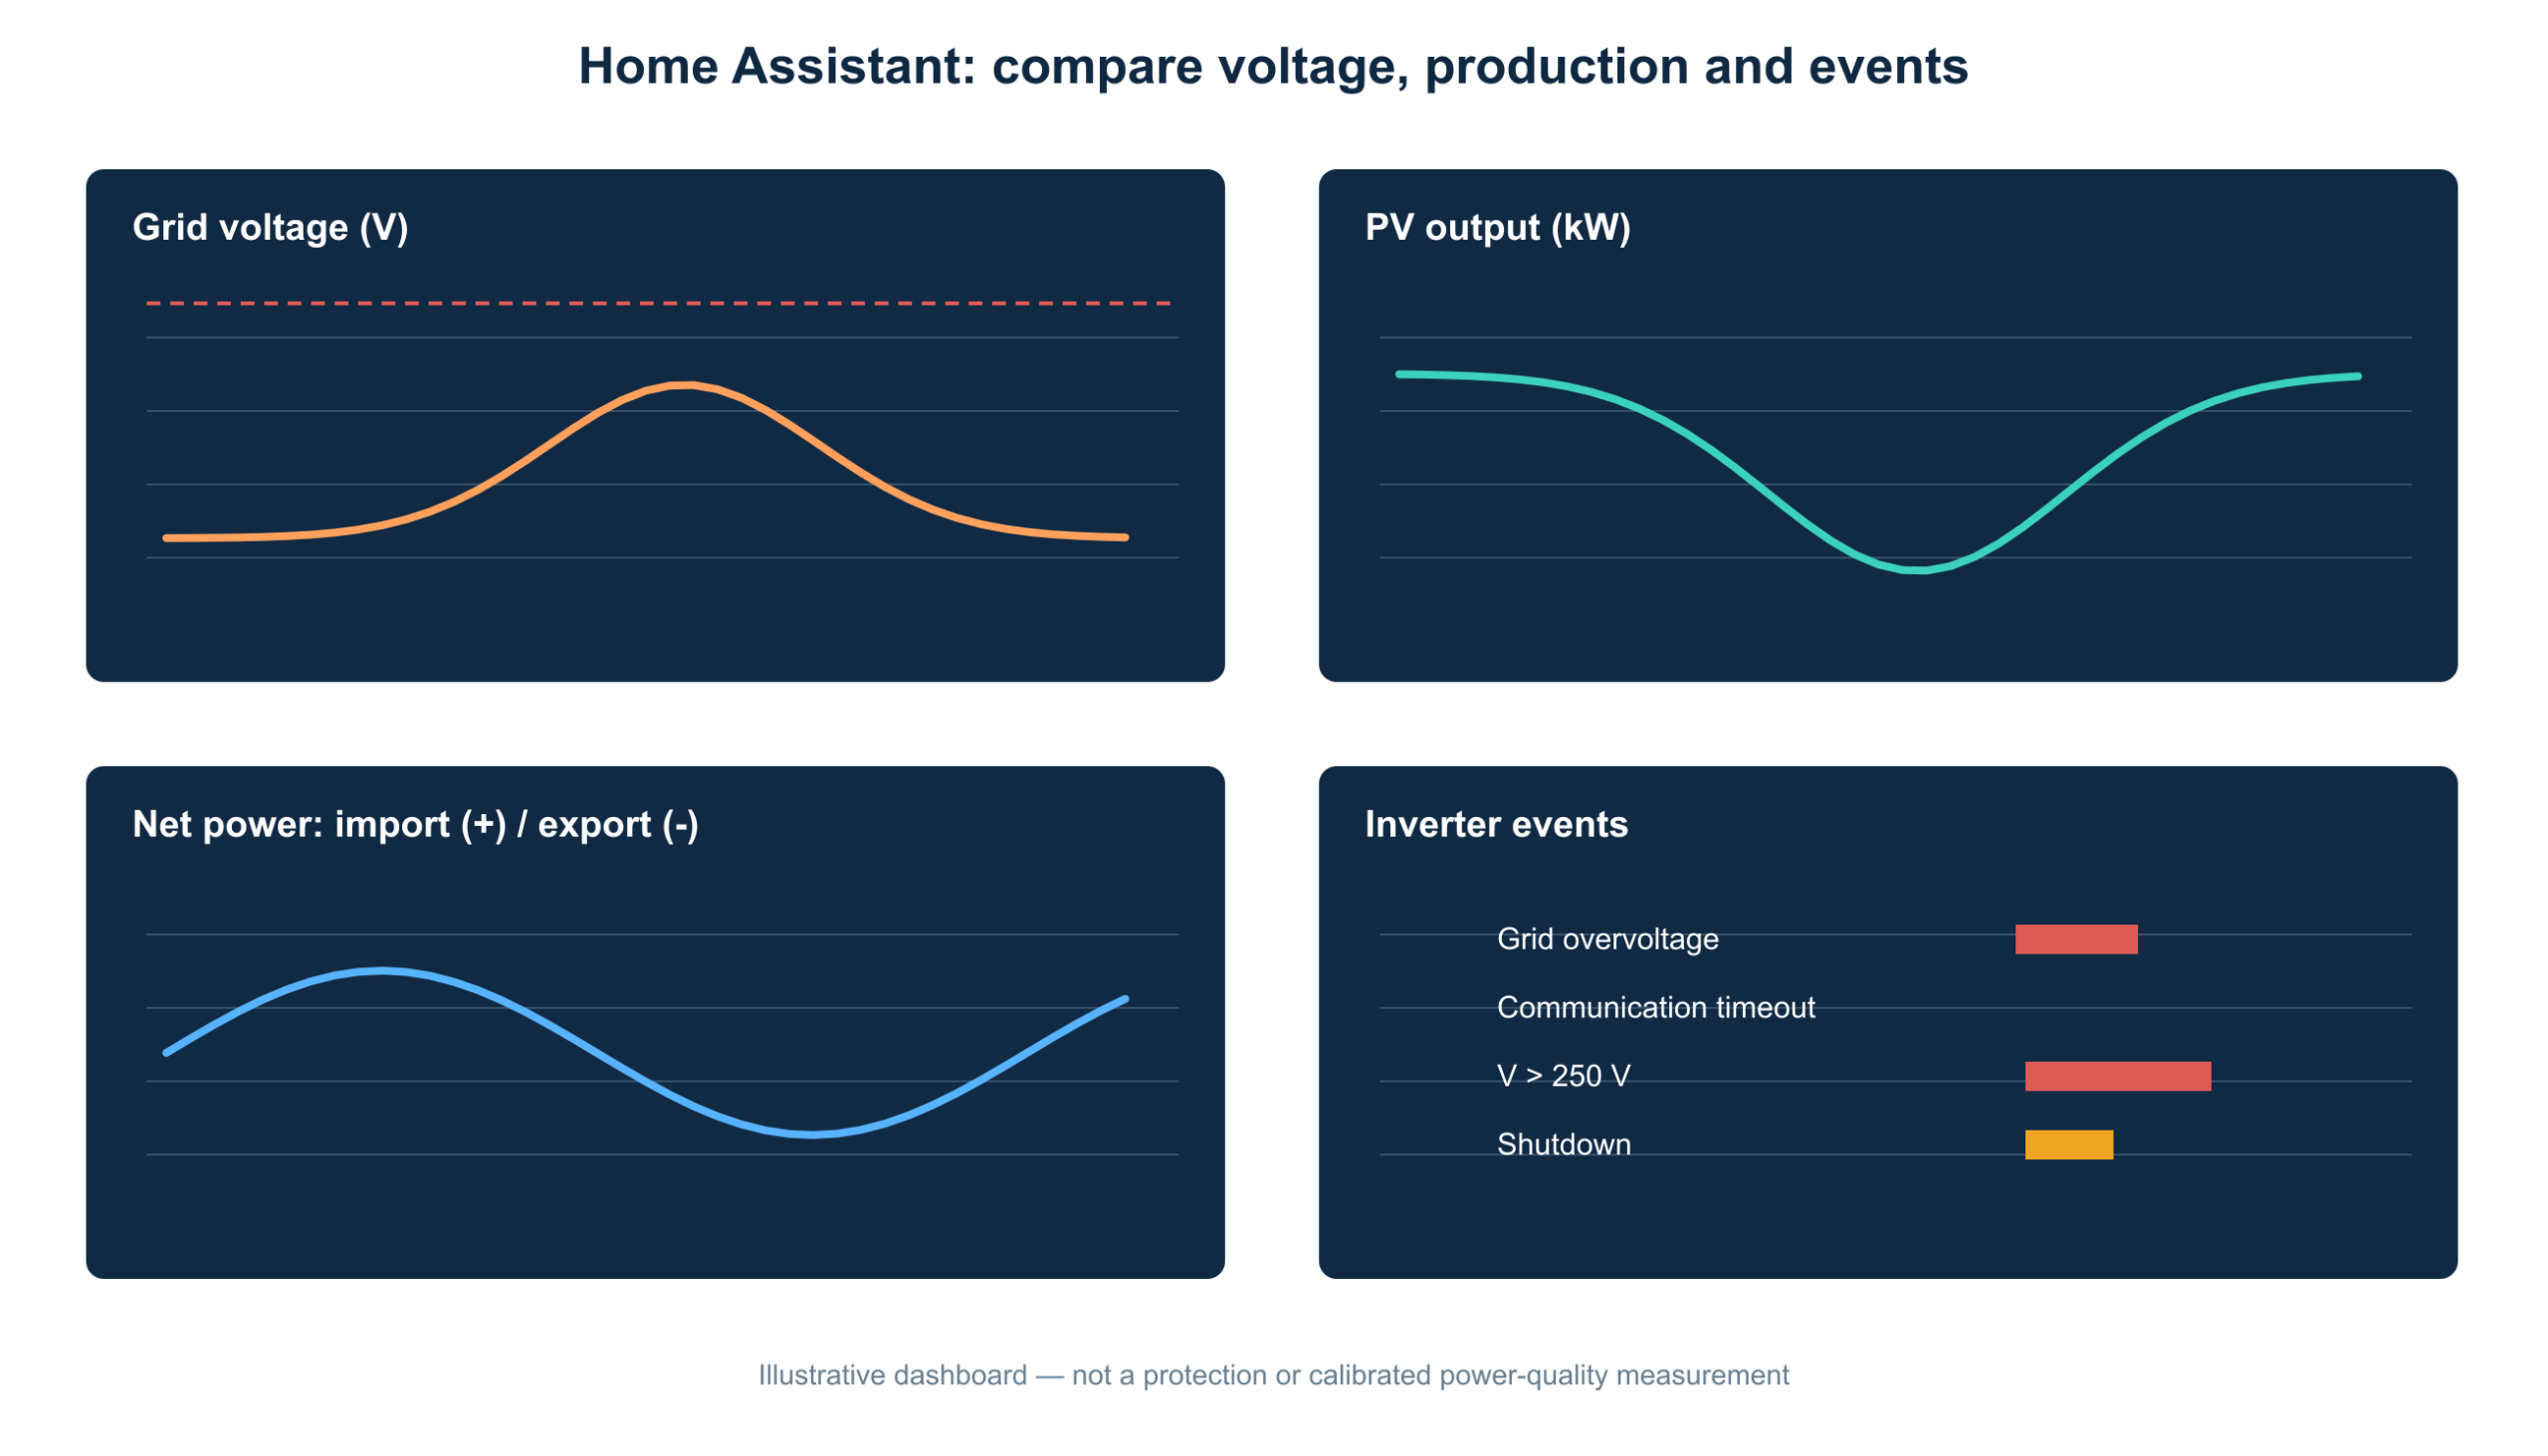
For a technically interested user, Home Assistant can bring together information from several sources. Where available, combine:
- Voltage per phase from a P1 meter or a suitable DIN-rail meter.
- Current total PV output and daily production from the inverter or gateway.
- Net power imported or exported according to the smart meter.
- Inverter error codes and availability, if the integration actually provides them.
14.1 A simple YAML monitoring automation
The Home Assistant automation below sends an alert when a phase-voltage sensor that is genuinely available reads above 249 V continuously for five minutes. The 249 V threshold is a self-chosen preventive alert value, not a legal limit or protection setting.
alias: PV - alert on high phase voltage
description: Reports sustained elevated voltage on L1
triggers:
  - trigger: numeric_state
    entity_id: sensor.netspanning_l1
    above: 249
    for:
      minutes: 5
conditions: []
actions:
  - action: persistent_notification.create
    data:
      title: "PV monitoring: high voltage on L1"
      message: >-
        L1 has measured more than 249 V for 5 minutes.
        Check PV production, measurement location and inverter log.
mode: single
Replace sensor.netspanning_l1 with an existing sensor in your own installation. This YAML does not create a voltage sensor. If your P1 integration supplies no voltage readings, the value must first be made available through a suitable supported device.
14.2 What you must not automate
A smart contactor that physically disconnects solar panels at ‘249 V’ is not a substitute for certified inverter protection. The inverter’s internal protection must keep working independently when Home Assistant, the router, Wi-Fi or an external cloud connection fails.
Automation that disconnects PV because of dynamic electricity prices has a different purpose from voltage protection. Avoid multiple independent automations fighting over the same PV contactor. Define one clear owner of the switching command and use voltage analysis for monitoring, unless a professionally designed and permitted control system expressly requires otherwise.
14.3 A useful dashboard
Preferably arrange these graphs one below the other: (1) voltage per phase, (2) output per inverter or microinverter, (3) grid power using positive for import and negative for export, and (4) an event log. Add a time selector that lets you compare precisely the same minutes in every graph.
If you need more history or analysis, a Python/AppDaemon script can process trends over several weeks: how often was voltage above 249 V, which phase was involved, how much PV power was present, and which inverter actually stopped? Use it for diagnosis, not as an independent safety system.
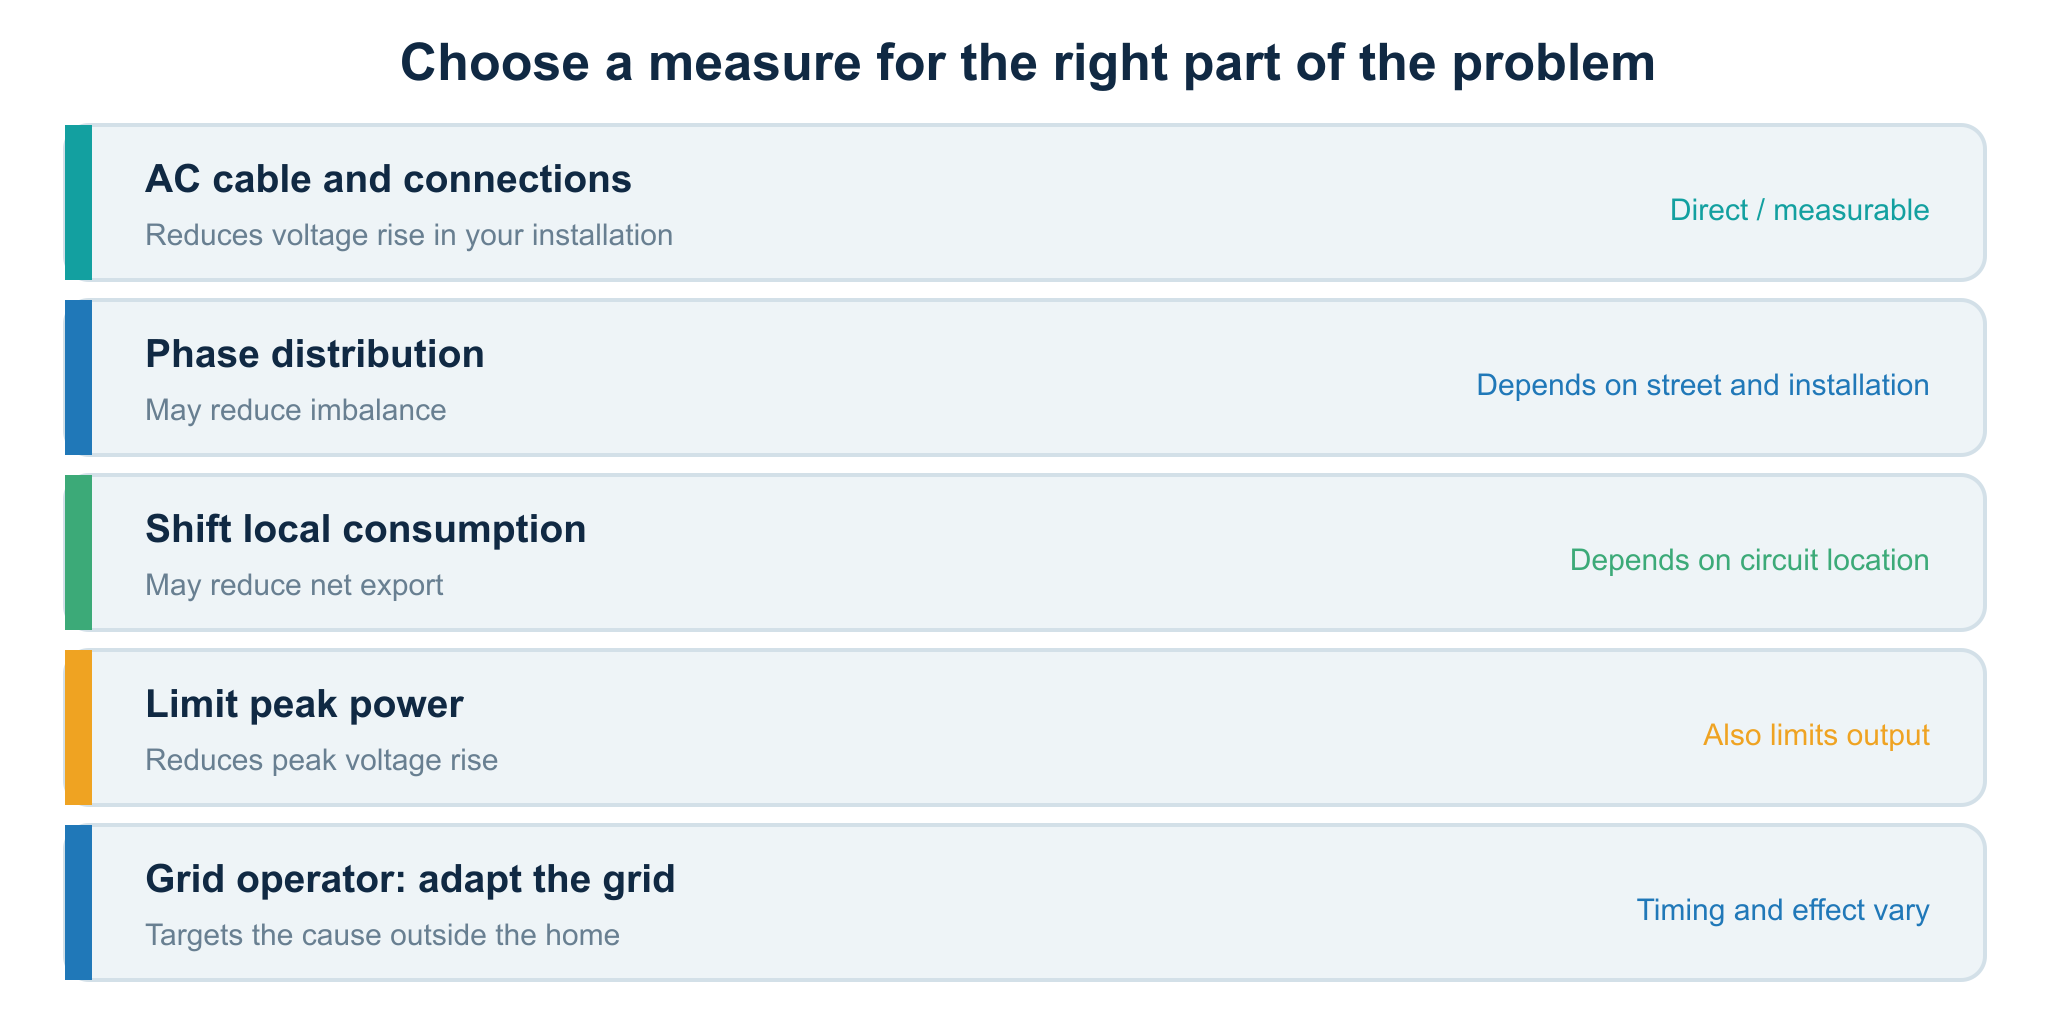
15. Which measures really help?
Different measures tackle different parts of the problem. Start by identifying where the additional voltage arises: inside your installation or on the grid upstream of your connection.
15.1 Have the AC cable and connections checked
If measurements show a large voltage difference between inverter and distribution board, a shorter or more appropriately sized AC circuit may help. Repairing poor contacts or an incorrect connection may also help. This is work for a competent installer.
Do not replace every cable with 6 or 10 mm² on a guess. First establish which cable is causing the relevant voltage difference, which supply configuration is present, and whether the measure makes electrical and economic sense.
15.2 Check phase distribution
With multiple PV systems and three-phase installations, distributing feed-in more evenly across phases may help. Actual voltages, cable topology, neutral conductors and protection still need assessment. ‘Just move it to the phase with the lowest voltage’ is oversimplified, because phase voltages change over time.
15.3 Use more energy locally while the panels produce
A tumble dryer, heat pump, water heater, dishwasher or electric car can consume energy during sunny hours. This reduces the home’s net export power. Its effect on inverter voltage depends on where the load is physically connected and which cable segments actually carry the current.
A load on another phase does not automatically reduce current in the cable of a single-phase inverter on L1. If voltage at the public connection is already too high, even substantial local consumption may not help enough. Shifting loads is useful for self-consumption, but not a guaranteed cure for overvoltage shutdowns.
15.4 Reduce peak output
Less peak output can mean less export current and therefore less voltage rise. Some inverters support an adjustable active-output-power limit or voltage-dependent control. That must not be confused with raising the disconnection-voltage threshold.
Settings must comply with the Dutch Grid Code, manufacturer documentation and any applicable permissions. A technically possible feature is not automatically available or permitted for a user to change. Have grid-critical settings assessed and configured correctly by a professional.
15.5 Contact the grid operator
If public-grid voltage is the main cause, measures on the grid side are needed. Depending on local circumstances, the grid operator can take measurements and investigate adjustments or reinforcement. Feasibility, timing and effects vary by street and transformer area.
Simply raising a neighbourhood transformer’s setting is not a solution: what looks favourable during strong daytime solar production can be unfavourable during high evening demand. The grid operator must assess several scenarios.
16. Why a home battery does not automatically solve the problem
A home battery can absorb some local generation at sunny times. This can reduce export to the public grid and, in suitable circumstances, help limit voltage rise. But it has limits.
A battery fills up, has a maximum charging current, incurs conversion losses and must be connected at the right electrical point to reduce the intended cable currents. Moreover, an inverter exporting through its own AC circuit can still see high terminal voltage while a battery elsewhere in the home is charging.
Without analysing the physical wiring and energy flows, the claim ‘get a home battery and your PV will no longer shut down’ is therefore not substantiated.
17. Hard shutdown or gradual curtailment: what is P(U)?
With a conventional protection response, the inverter produces up to a limit and then stops entirely. P(U) means voltage-dependent control of active power: as voltage rises, the inverter may reduce output to slow further rise.
There is also Q(U), control of reactive power as a function of voltage. Its possibilities, grid effects and conditions differ from P(U). Neither control is permission to change protection thresholds.
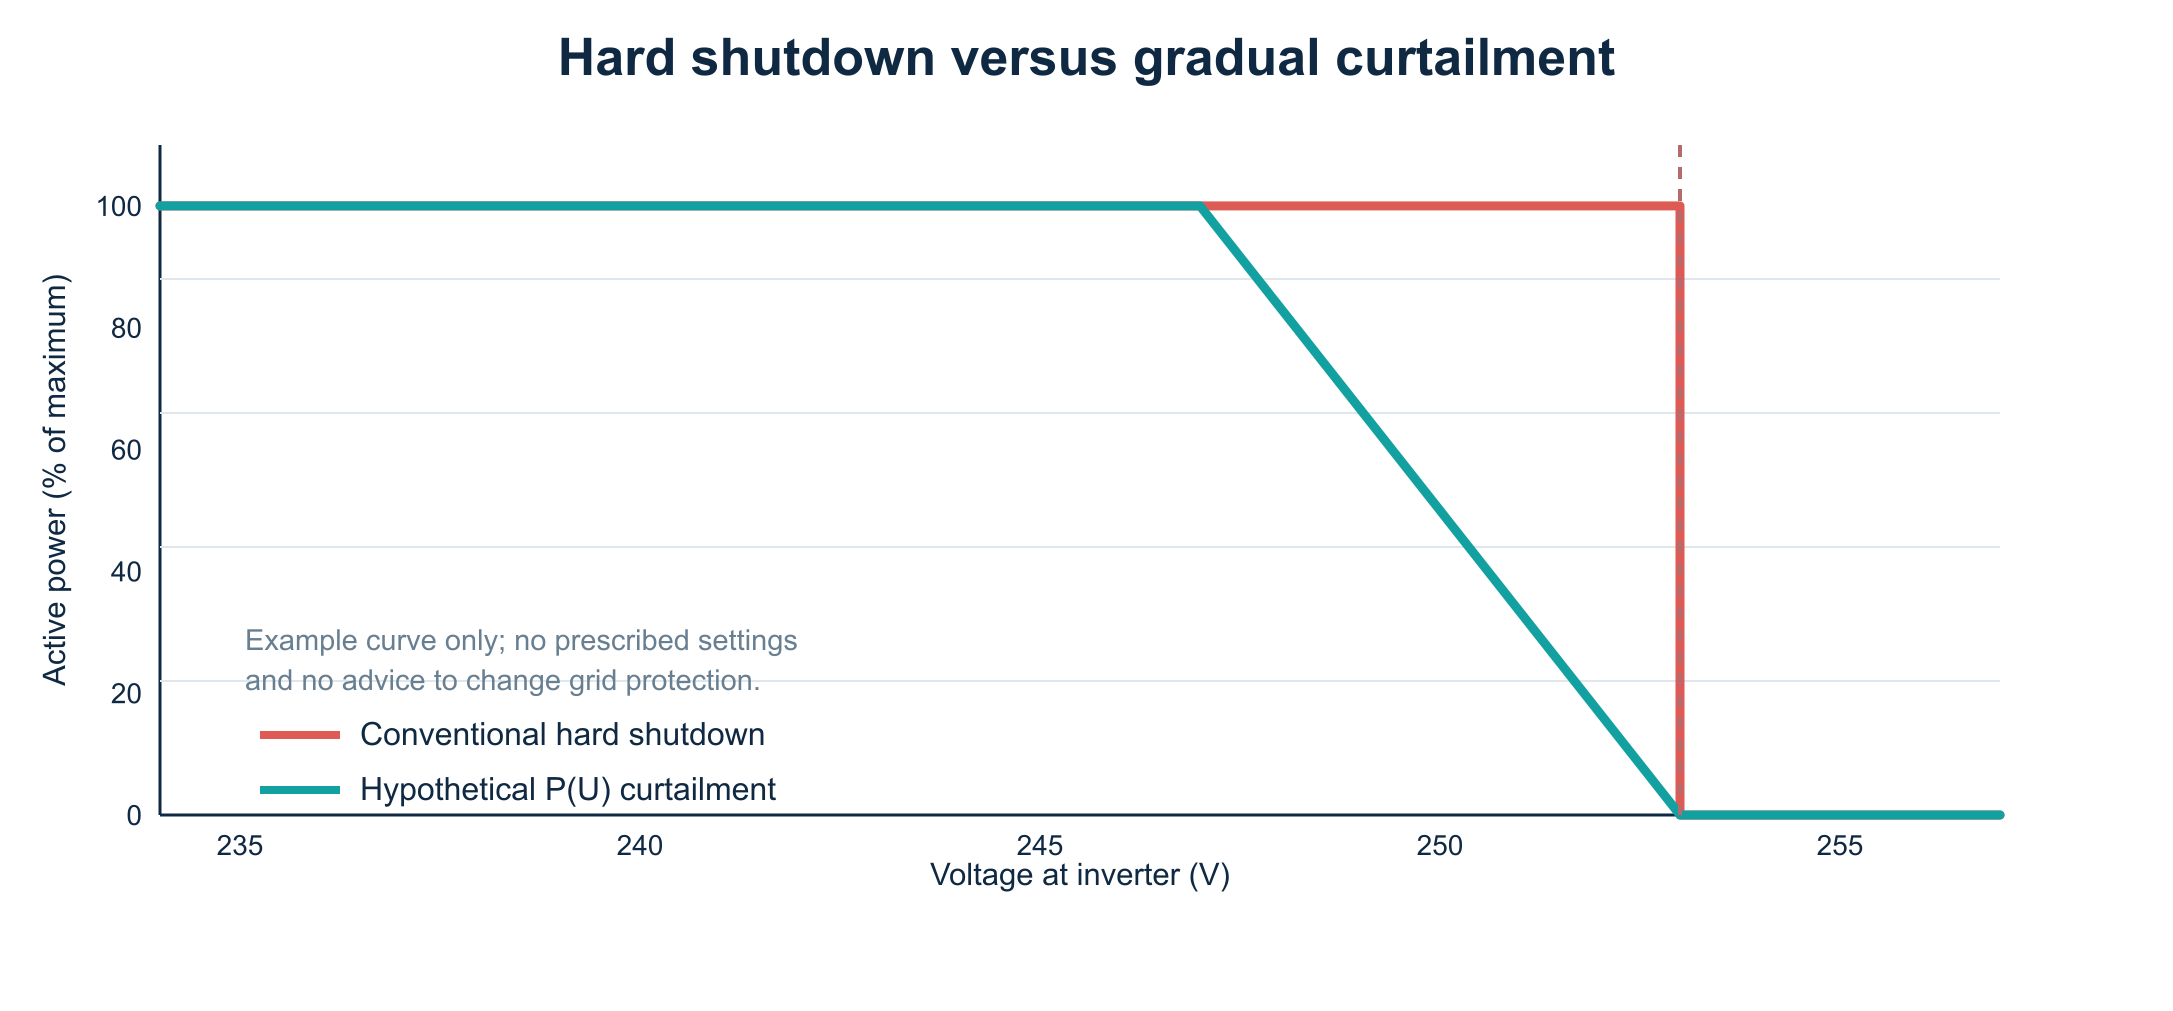
The P(U) curve in the image is a conceptual example. Its chosen start voltage, slope and response are not prescribed and are not settings advice. A study for the Dutch Ministry of Climate Policy and Green Growth, published on 9 March 2026, estimates that 70–90% of inverters installed since 2018 are, in principle, suitable for some forms of power control without physical modification, but those functions have usually not yet been put into operation. This is an interesting area of development, not a guarantee that a particular existing inverter can immediately curtail safely and legally. [1]
18. The Grid Code, standards and legal context
The main documents for this subject have different purposes:
| Document / framework | What does it cover? |
|---|---|
| Netcode Elektriciteit (Electricity Grid Code) | Grid conditions and connection requirements, including the protection and connection behaviour of generating installations. |
| NEN-EN 50160 | Voltage characteristics on public grids, including time averages and quality criteria. |
| NEN 1010:2020+C1:2024 | Safe design, construction and modification of low-voltage installations. |
| NEN 3140 | Safe operation of and work on low-voltage installations. |
| RfG / connection rules | European and national connection requirements for electricity-generating units. |
These frameworks are not interchangeable. For example, a NEN 1010 cable-sizing requirement does not itself establish the precise inverter-protection parameter that may be configured. Nor is the latest published edition of a standard automatically the edition designated in every legal reference.
18.1 What must you not change yourself?
An inverter’s Dutch grid profile, overvoltage thresholds and protection functions are safety- and grid-critical. Selecting another country profile or manipulating voltage protection to keep exporting longer is not the right remedy. Liander explicitly warns about damage and fire risks and failure to comply with the Dutch Grid Code. [2]
Increasing the cross-section of an AC cable is technically quite different from raising a disconnection threshold. The first changes installation impedance; the second changes the protection conditions for grid-connected equipment.
19. What does inverter downtime cost?
The cost depends not only on hours without export, but also on sunlight during each interruption, potential generation, the share of self-consumption and the financial value of each kWh at that time.
A simple upper-bound calculation is:
Lost energy (kWh) ≈ average missing power (kW) × downtime (hours).
If an average of 3.0 kW is not produced during a total of 20 hours of interruptions, the lost energy is about 60 kWh. At an assumed value of €0.10/kWh, that is €6. The €0.10 is purely an illustrative assumption, not a forecast of export payment or financial loss.
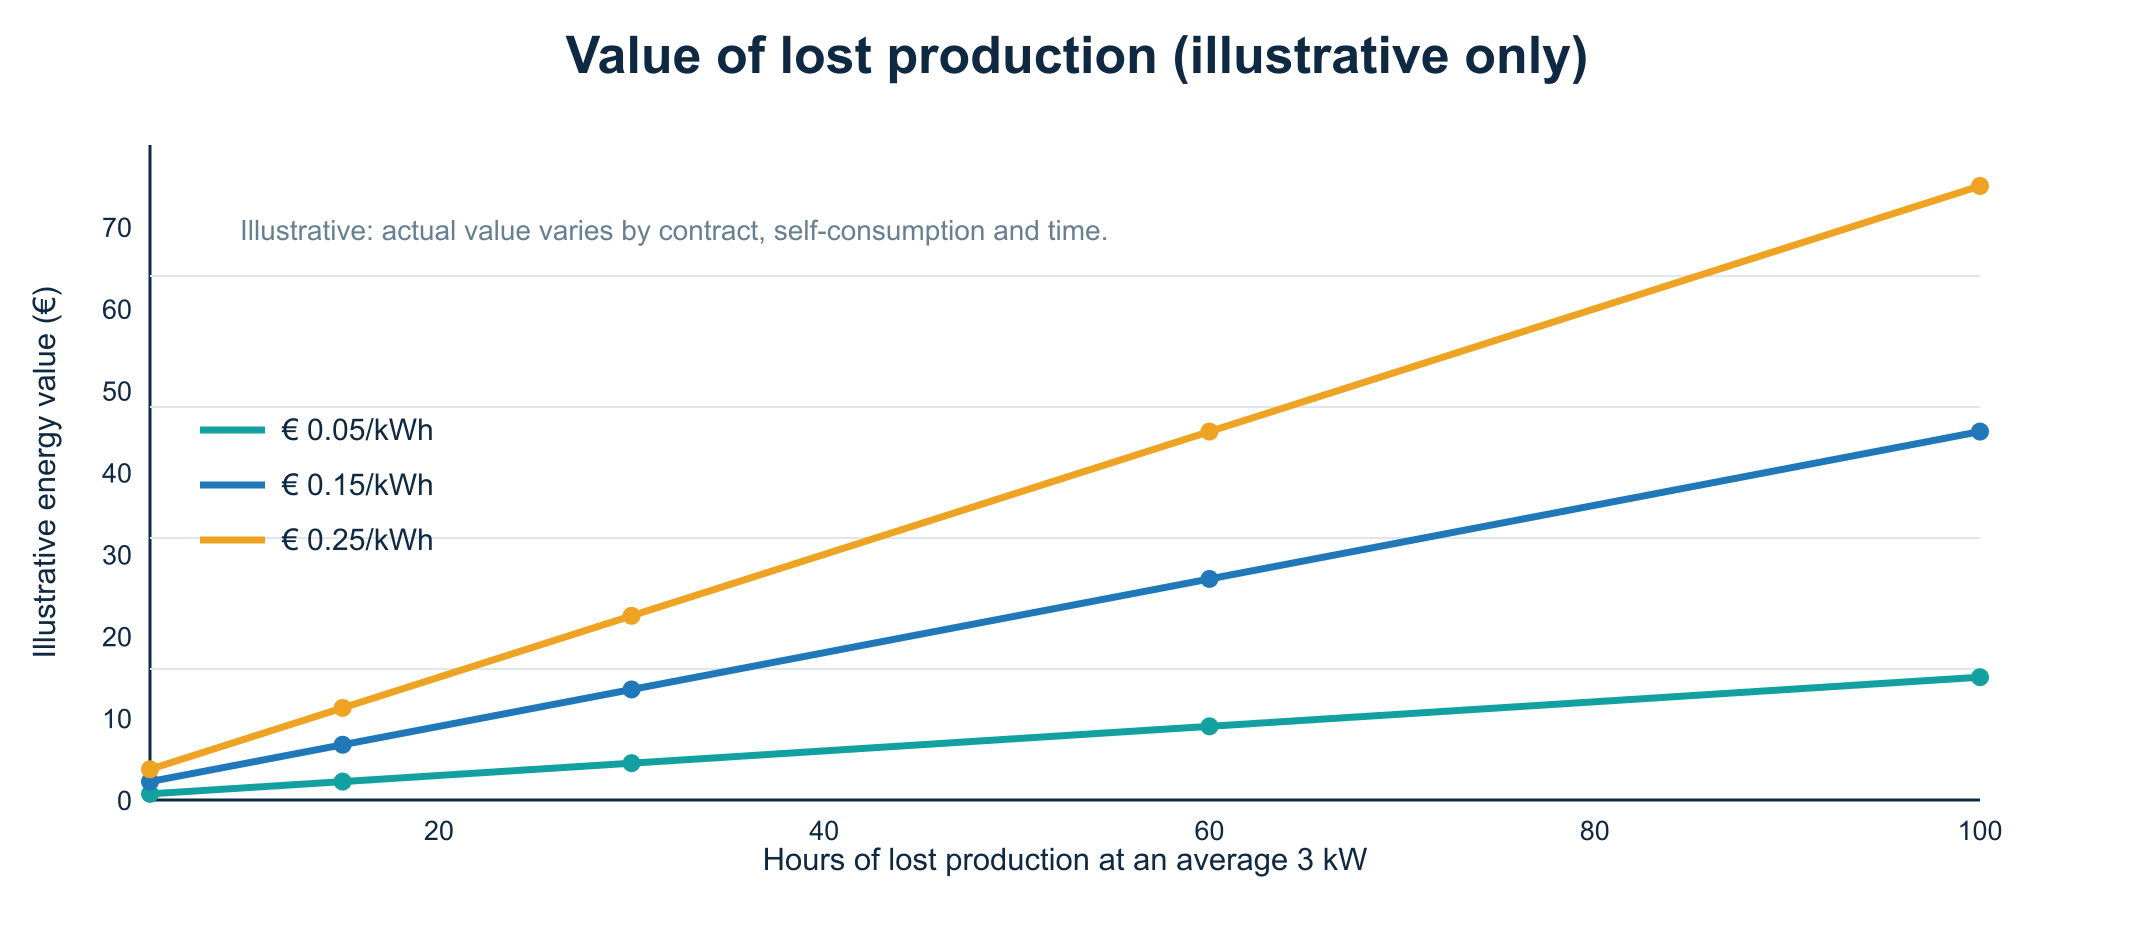
Beware of false precision: seeing actual generation on a graph does not tell you exactly what the panels would have produced without the shutdowns. For a better estimate, use irradiance data, comparable days and a carefully adjusted PV forecast. Clouds, panel temperature and deliberate power limiting can substantially change the result.
20. Case study: 16 panels with several microinverters
Imagine a home with 16 solar panels of about 395 Wp, giving roughly 6.3 kWp DC capacity, and several microinverters spread across three phases. Exact AC capacity depends on the microinverters’ specifications and limits.
On a clear spring day, the owner sees production rise to about 4.7 kW, suddenly fall to 3.7 kW and recover later. During the same period, monitoring shows rising voltage on one phase. Some microinverters report a grid-voltage-related event.
The correct analysis is neither ‘a panel is broken’ nor immediately ‘the grid operator supplies 253 V’. The owner first collects error messages per microinverter, time-synchronised phase voltages and production data. An installer then checks how the microinverters are distributed across AC branches and phases. Only after the home’s own circuit has been ruled out as the cause is a suspected public-grid problem reported to the grid operator with supporting data.
This case study is fictional, but reflects the phenomenon described in the Dutch-government study: microinverters farther along an AC trunk can disconnect sooner. [1]
21. What exactly should an installer investigate?
Ask for a measurement-based investigation rather than a general opinion. A useful report includes:
- The inverter configuration and the Dutch grid profile applied.
- Exact error codes, times and voltage readings at the inverter.
- The AC circuit’s construction: lengths, conductor cross-sections, installation method, connections and protection.
- The phases actually used by inverters and substantial loads.
- Comparable voltage measurements at inverter and distribution board, simultaneous where possible.
- Assessment of heating, damaged connections and any departures from NEN 1010.
- A conclusion on whether voltage rise arises mainly inside the installation or at the public-grid connection point.
- A substantiated proposal, including the expected reduction in voltage and its limitations.
A valuable report also states uncertainties: how quickly did the logger sample, where was its sensor, which phase was measured and how much power was the PV installation delivering at that exact time?
22. What information should you give the grid operator?
If your AC circuit has been checked and a grid-voltage problem is suspected, describe the situation as specifically as possible. Include your address only in correspondence with the grid operator, not in public screenshots or forums.
Provide the dates and times of shutdowns, inverter type, relevant error codes, available voltage trends per phase and the installer’s conclusion. Make clear where each voltage was measured. A reading at the inverter is not the same as one at the grid operator’s connection point.
Stedin, Liander and Enexis have dedicated pages for reporting or investigating voltage problems. Their approach and response time vary by area. [2][3][4]
23. Common mistakes
‘My P1 meter reads 249 V, so my inverter cannot trip at 253 V.’ Incorrect. Voltage rise along the AC circuit may make the inverter read higher.
‘The inverter is broken because it switches off by itself.’ Not necessarily. Grid-voltage protection is part of correct operation. Check the error code.
‘Every AC cable must always be 6 mm².’ No. Cross-section and installation method follow from the complete design, loading, protection, length, temperature and applicable rules.
‘I will choose the German country code so it keeps working.’ Do not do this. It may change grid-critical protection parameters outside Dutch requirements.
‘If I turn on an appliance, inverter voltage is guaranteed to fall.’ No. That depends on the actual cable route and the phase to which the appliance is connected.
‘With microinverters, everything always shuts down together.’ No. Individual units or branches may stop.
‘Home Assistant can take over grid protection with a sensor set to 253 V.’ No. A network-dependent home automation system can never replace certified inverter protection.
24. Frequently asked questions
Is 250 volts harmful?
250 V is high relative to nominal 230 V, but still below +10% on its own. Whether a voltage-quality problem really exists depends on duration, measurement point and relevant quality requirements. If voltage continues rising, the inverter can approach its upper limit.
Why does my inverter shut down only in April and May?
Solar irradiance can be strong in those months while outdoor temperatures remain relatively low, which benefits panel efficiency. At the same time, local electricity demand may be limited. Together, these factors can increase export and voltage rise. This is a common explanation, not a diagnosis without measurements.
Is 253 volts a threshold at the smart meter or at the inverter?
For the inverter protection discussed here, the relevant voltage is at the inverter. Grid quality at the point of connection is assessed separately. The two readings can differ by several volts.
Can a longer or shorter cable remove the problem?
Under otherwise equal conditions, a longer cable generally adds impedance and therefore more voltage rise. A shorter or better-sized circuit can help if your own AC circuit is demonstrably contributing to the problem.
Can moving to another phase help?
Sometimes, but that must be determined from measurements and the actual connection design. An installer must carry out any phase reassignment.
Does a home battery always work?
No. Charging power, state of charge, wiring and phase distribution limit its effect. A full battery temporarily cannot absorb more energy.
Can I use Home Assistant to switch off the inverter at 250 V?
Deliberate switching is technically different from replacing built-in grid protection. Use Home Assistant primarily to record trends and faults; have protection and power-control functions designed in accordance with the applicable requirements.
Should I call an installer or the grid operator?
If you suspect an inverter fault or a problem in your own AC circuit, contact an installer first. If your installation proves not to be the cause, the grid operator can investigate voltage at its connection point.
25. Reader checklist
- I have looked up the inverter’s exact error code.
- I know whether one unit, one branch, one phase or the entire PV installation is affected.
- I have recorded voltage and PV output at matching times.
- I know what my voltage sensor measures and where it is located.
- I have examined several sunny days.
- I have not changed the country code or overvoltage threshold.
- I will have my AC circuit assessed by a competent installer.
- I will report the issue to the grid operator if voltage at the public-grid connection point appears too high.
26. Conclusion
A PV inverter does not shut down at high grid voltage to inconvenience you: it does so to operate safely on a public electricity grid. The familiar 253 V comes from nominal 230 V plus ten percent. Export raises voltage along cables and connections, so the inverter can see a higher voltage than the smart meter.
The main task is separating two possible contributions: voltage rise in the home’s own AC wiring and the voltage supplied to the home by the grid operator. One app reading or one P1 measurement cannot establish this reliably. Combine inverter logs, the right measurement points, phase information and an inspection of the AC circuit.
Improved forms of power control are being developed for modern inverters. The Dutch-government study published in 2026 shows considerable technical potential. Until then, the safe order remains the same: do not bypass protection; demonstrate the cause and address it directly.
Safety, standards context and editorial responsibility
This article is technical information and an aid to diagnosis. It is not a wiring instruction, inspection report, electrical design, declaration of conformity or permission to change grid-critical settings. Diagrams show principles and must not be used as installation wiring plans. Have work on PV AC installations, distribution boards and connection points carried out by a competent installer in accordance with applicable NEN 1010 requirements, safe working procedures and manufacturer and grid-operator documentation. Both AC and DC sides of a solar installation can carry dangerous voltages; turning off a main switch does not necessarily de-energise every PV component.
Standards and regulations change. Before design, inspection or modification, check the legally designated editions, the current Dutch Electricity Grid Code and product-specific Dutch connection requirements. This article was updated on 15 October 2026. All calculations and graphs are illustrative and use assumptions.
Sources and further reading
- Dutch government / De Zonnemeesters (9 March 2026) — Technische analyse van zonnestroom-omvormers bij kleinverbruikers. Study of 253 V, microinverters and the potential for active-power control. https://www.rijksoverheid.nl/documenten/2026/03/09/technische-analyse-van-zonnestroom-omvormers-bij-kleinverbruikers
- Liander — Omvormer schakelt uit. Protection threshold, diagnosis, reporting and why grid-critical settings must not be changed. https://www.liander.nl/storingen-en-onderhoud/spanningsproblemen/omvormer-schakelt-uit
- Enexis — Mijn omvormer valt uit. Why voltage can rise and which first checks are useful. https://www.enexis.nl/storingen-en-onderhoud/problemen-op-uw-adres/omvormer-valt-uit
- Stedin — Spanningsproblemen. AC cable, phase distribution and suitable measures. https://www.stedin.net/aansluiting/ik-ga-energie-opwekken/spanningsproblemen
- Netbeheer Nederland — Spanningskwaliteit. Background on nominal grid voltage and quality criteria. https://www.netbeheernederland.nl/veiligheid-en-infrastructuur/spanningskwaliteit
- NEN — NEN 1010:2020+C1:2024. Standard information on safe low-voltage installations. https://www.nen.nl/nen-1010-2020-c1-2024-nl-325089
- Netbeheer Nederland — Zonnepanelen en spanningsproblemen: dit kunt u zelf doen. Background and advice. https://www.netbeheernederland.nl/artikelen/nieuws/zonnepanelen-en-spanningsproblemen-dit-kunt-u-zelf-doen
- NEN — NEN 3140:2011+A3:2019. Standard information on safe work and operation. https://www.nen.nl/nen-3140-2011-a3-2019-nl-261555
Copyright MechScript — reuse of the article text only with the publisher’s permission. The original diagrams and graphs were made for this publication; the cover is illustrative and does not depict a specific certified connection design.