
A rooftop produces far less solar electricity in December than in June. The cold is rarely the culprit. The sun is low, days are short and skies are often cloudy. Here is what that means in the Netherlands, with verified figures, practical examples and useful checks.
1. When winter makes a healthy system look broken
In June, a solar production graph often looks impressive. In December, the same graph can remain close to zero. The panels have not suddenly worn out, and the inverter is not necessarily faulty. In the Netherlands, the biggest change is the amount of sunlight reaching the roof.
A solar module can produce electricity in cold weather, under cloud and even in light frost. But it cannot convert more sunlight than it receives. So the real question is not why the technology works worse in winter, but why so little solar energy reaches the module.
This article explains the difference using published monthly percentages, a clear numerical example and a practical checklist for your own installation.
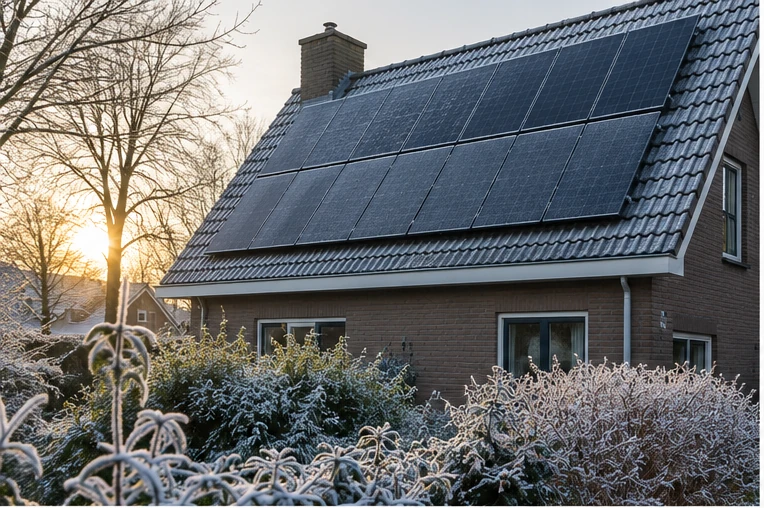
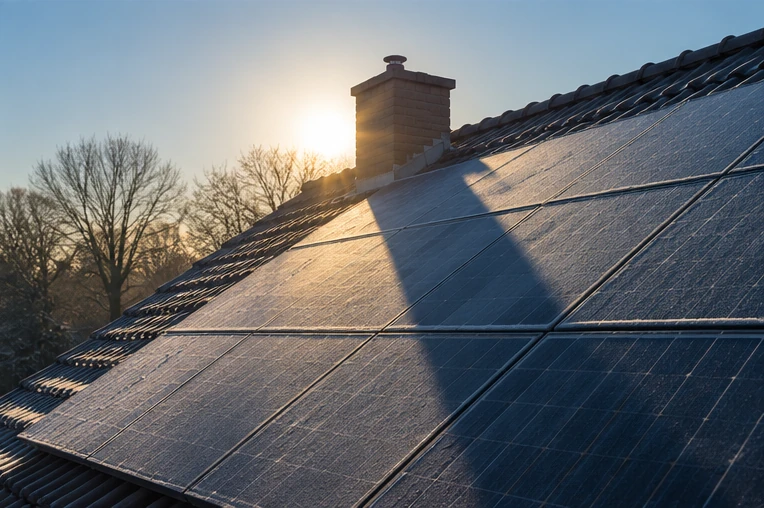
A cold winter morning with a low sun: the system can work normally while available sunlight remains limited.
2. Most solar production does not occur in winter
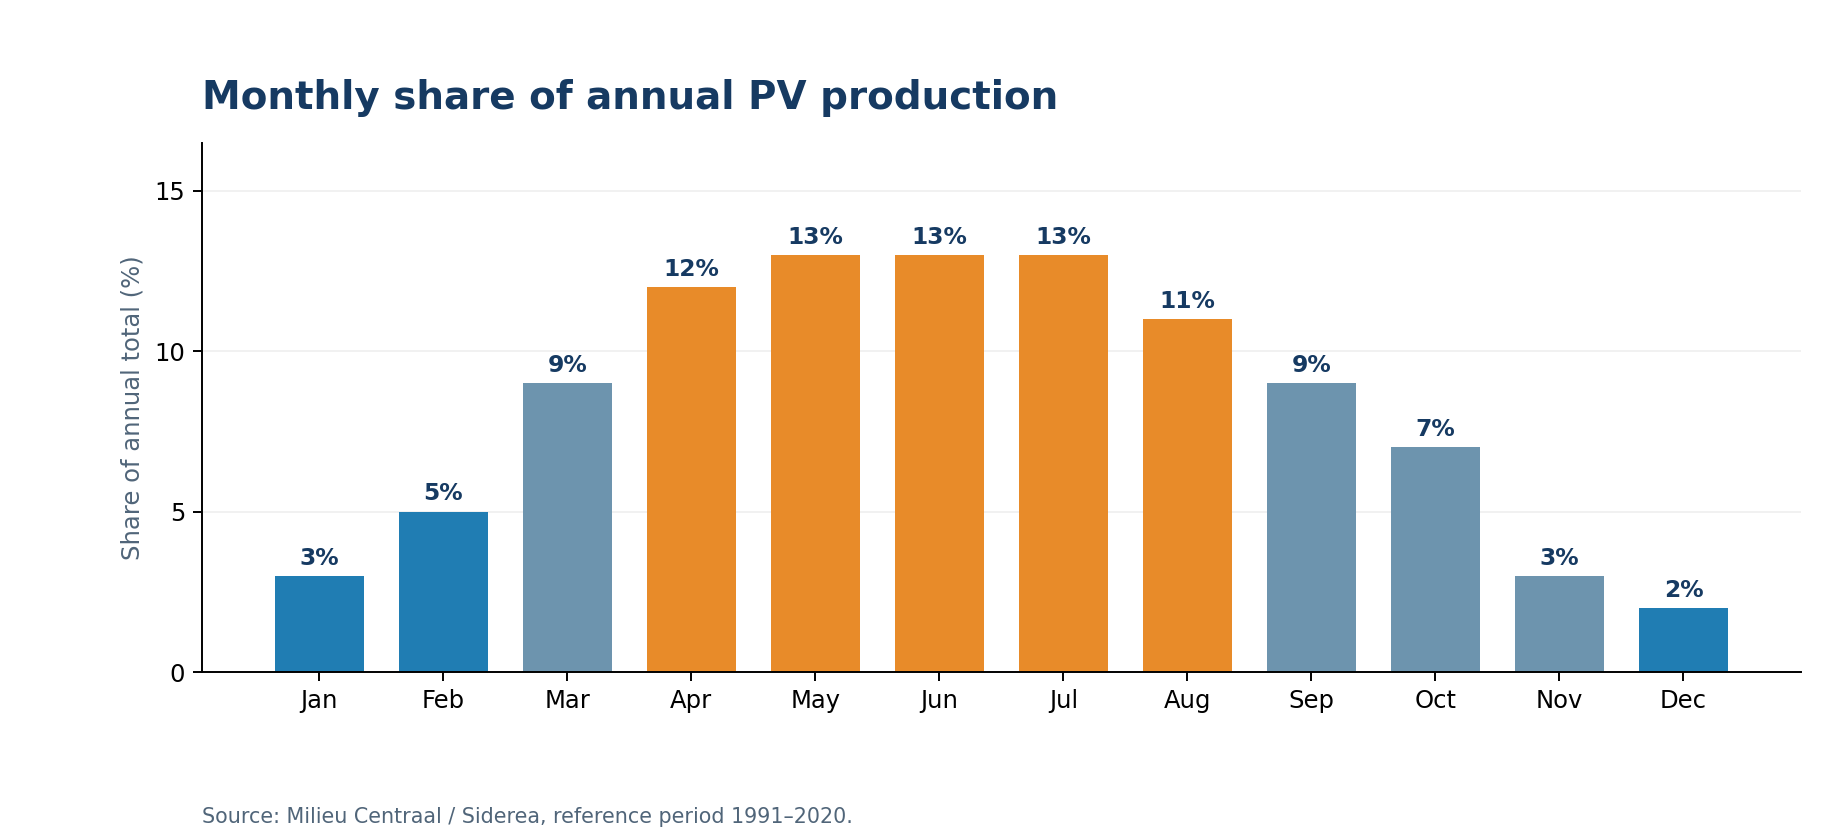
Milieu Centraal publishes a Dutch monthly distribution based on Siderea data from 1991–2020. The pattern is clear: December 2%, January 3% and February 5%. Together these three winter months account for around 10% of annual energy production. The five months from April through August account for approximately 62%.
These percentages are a national indication, not a promise for your own roof. Location, pitch, shading, weather and system design all change the result. But if a system generates much less in December than in June, that is usually normal.
Important: ‘10% in winter’ does not mean 10% of the system’s maximum power rating. It means those three months together produce about one tenth of the annual total in kWh.
3. Worked example: 6,000 kWh in a year
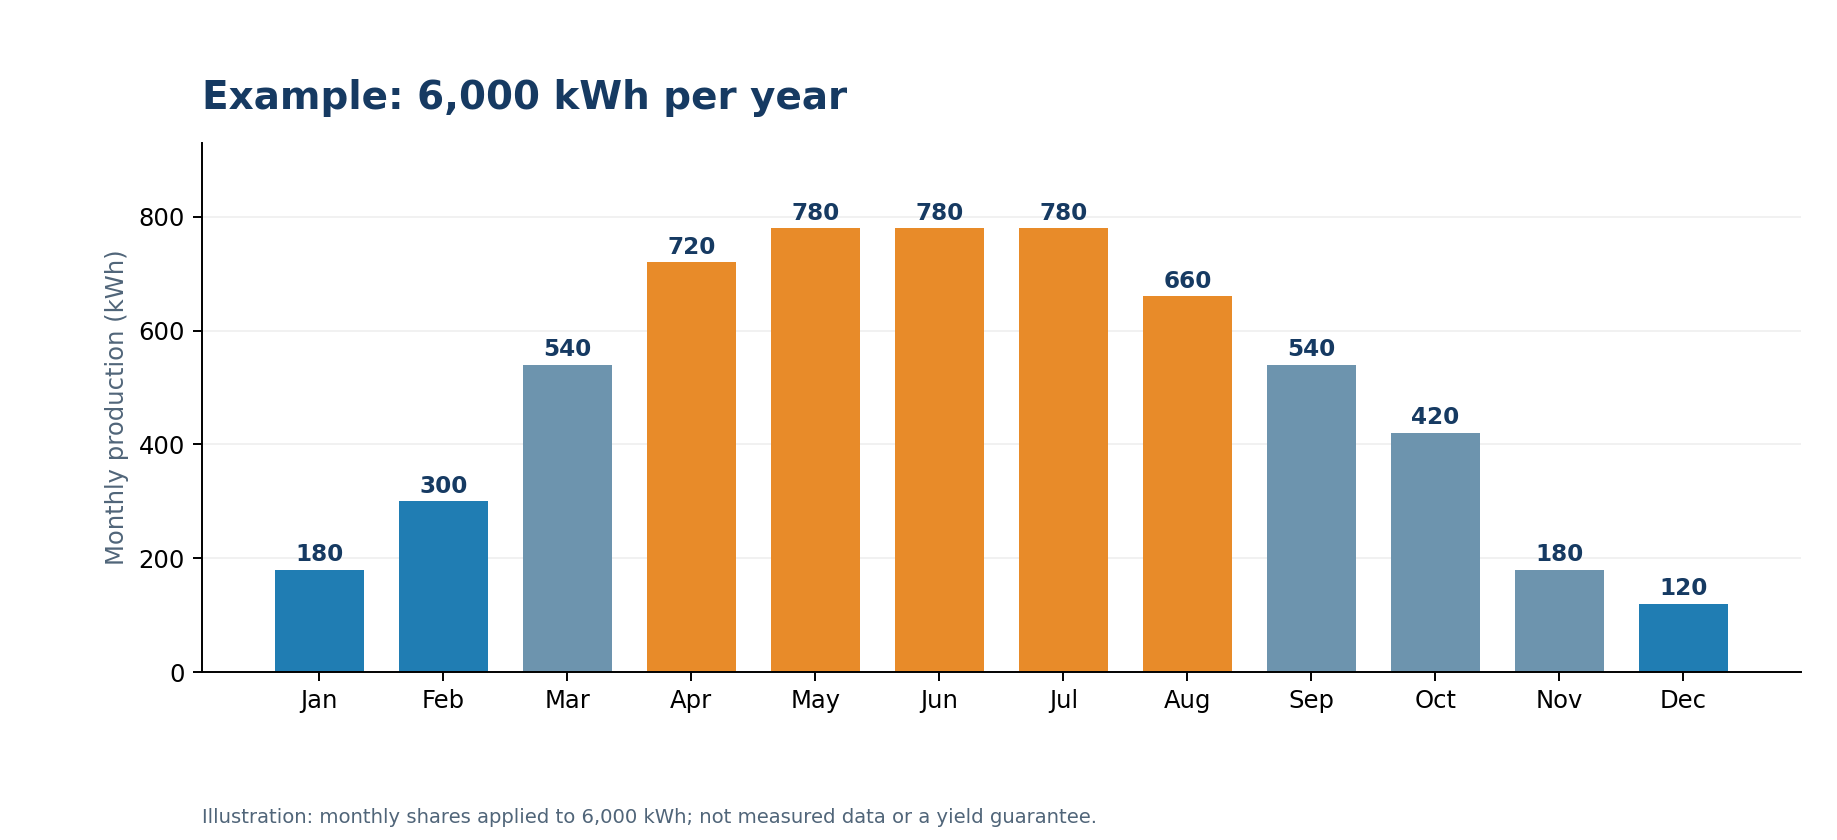
Imagine a home that generates 6,000 kWh of solar electricity in a full year. Applying the Dutch monthly distribution to that annual total gives the example below. December contributes 120 kWh, January 180 kWh and February 300 kWh: 600 kWh together. May, June and July each contribute 780 kWh.
This is not an actual measured system or a production guarantee. It is a clear calculation illustrating how strongly the seasons affect yield. A real installation may produce less in a cloudy December or more in an unusually sunny month.
Remember that a monthly total says little about the maximum power seen on a single afternoon. You can reach a respectable peak and still gather few kWh over a month because the days are short.
4. Cause 1: the sun is much lower
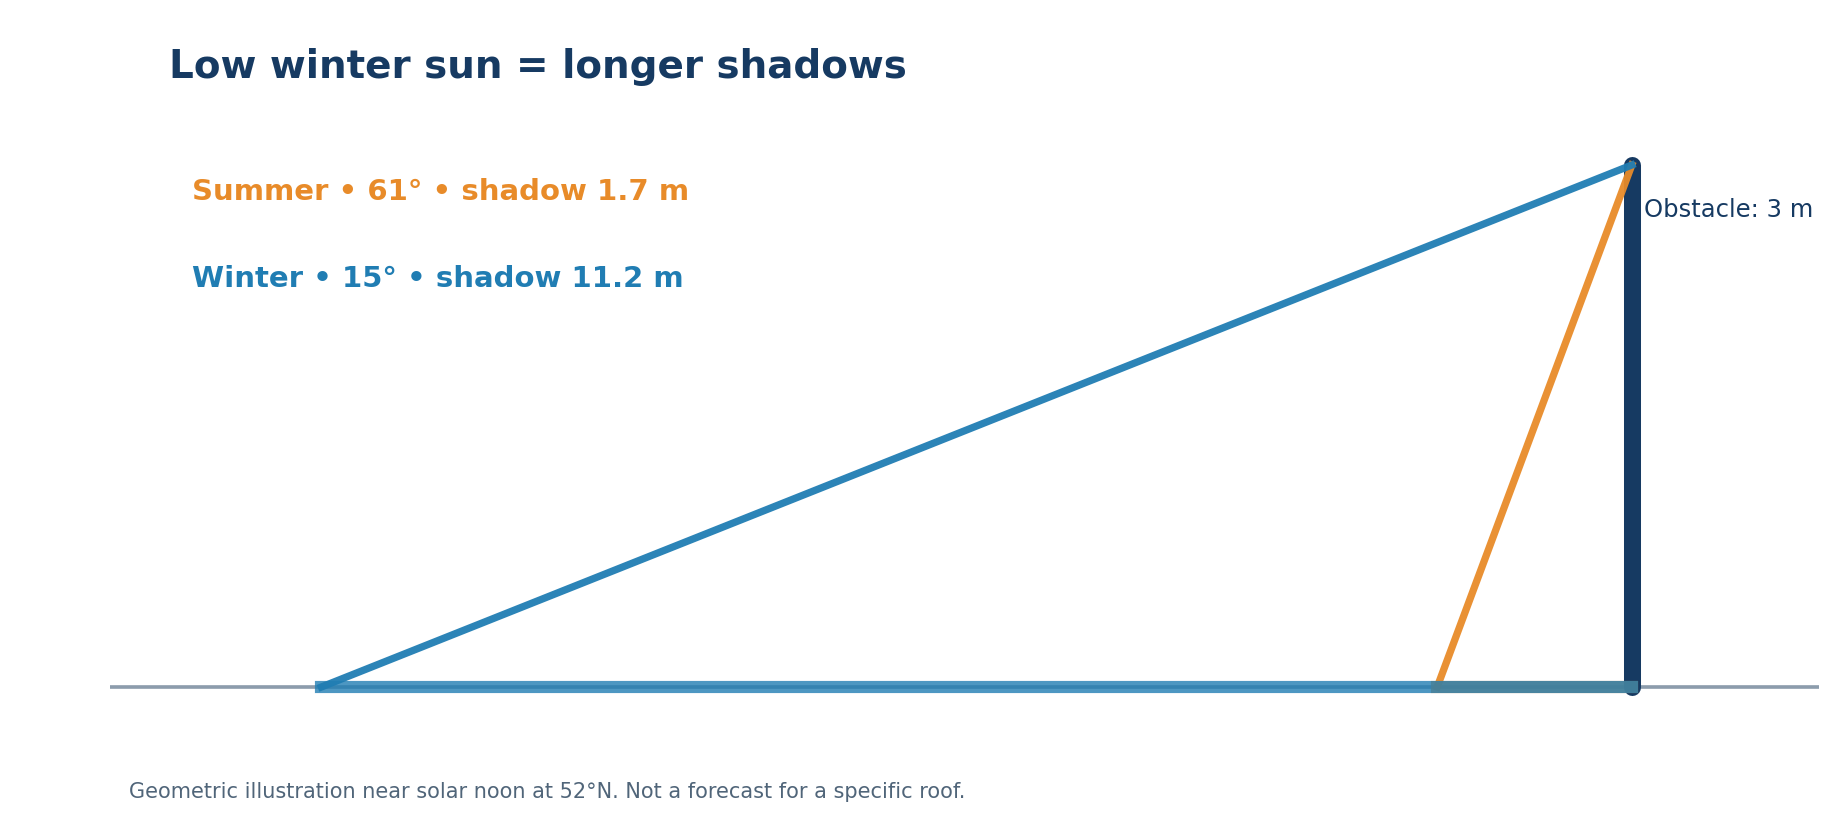
The angle of sunlight is perhaps the single most important difference. In the Netherlands, near solar noon around the start of summer the sun reaches approximately 61° above the horizon, versus about 15° near the start of winter (example for 52° north). That changes the angle at which sunlight reaches a rooftop array and reduces the energy available.
The Dutch meteorological institute KNMI has analysed this effect. Between the longest and shortest days in the Netherlands, the lower solar altitude contributes slightly more to the difference in total solar energy than the shorter daylight period does.
This also explains longer winter shadows. An object 3 metres high casts a shadow of about 11.2 metres at 15° sun altitude, compared with about 1.7 metres at 61°. This is a geometric illustration, not a shade assessment for any specific property.
5. Cause 2: the days are short
In summer, the sun remains above the horizon for much longer. A system has more hours in which to collect energy. In December, the useful window is short, and an inverter may start relatively late or stop early. That is not necessarily a fault: at very low irradiance, the panels simply do not supply enough power for the inverter to operate effectively.
KNMI explains that winter days receive far less total solar energy than the longest summer days. The full-day difference can be larger than you might expect by looking only at sunlight around noon.
So a production graph can remain relatively low throughout the day even when the sky clears briefly at midday.
6. Cause 3: clouds and diffuse light
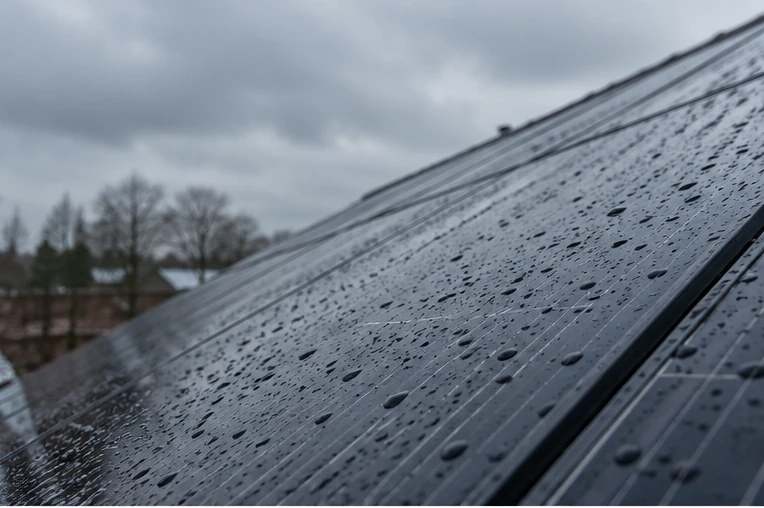
Solar panels do not need a perfectly blue sky. Diffuse daylight still reaches the modules when the sun is hidden behind clouds. Production is simply much lower. The Netherlands experiences more prolonged dull weather in winter. KNMI reports an average of nine days with no recorded sunshine in January, compared with roughly one day in May.
So an array may still produce some electricity on a grey day, but there is nothing unusual about a production curve far below rated capacity. The low output is caused by limited irradiance, not because the panels ‘stop working’ in the cold.
A clear, cold winter afternoon can perform surprisingly well. Irradiance is higher and cool solar cells work relatively efficiently. But that one day cannot replace the long sunny days of spring and summer.
7. Cold weather actually helps somewhat
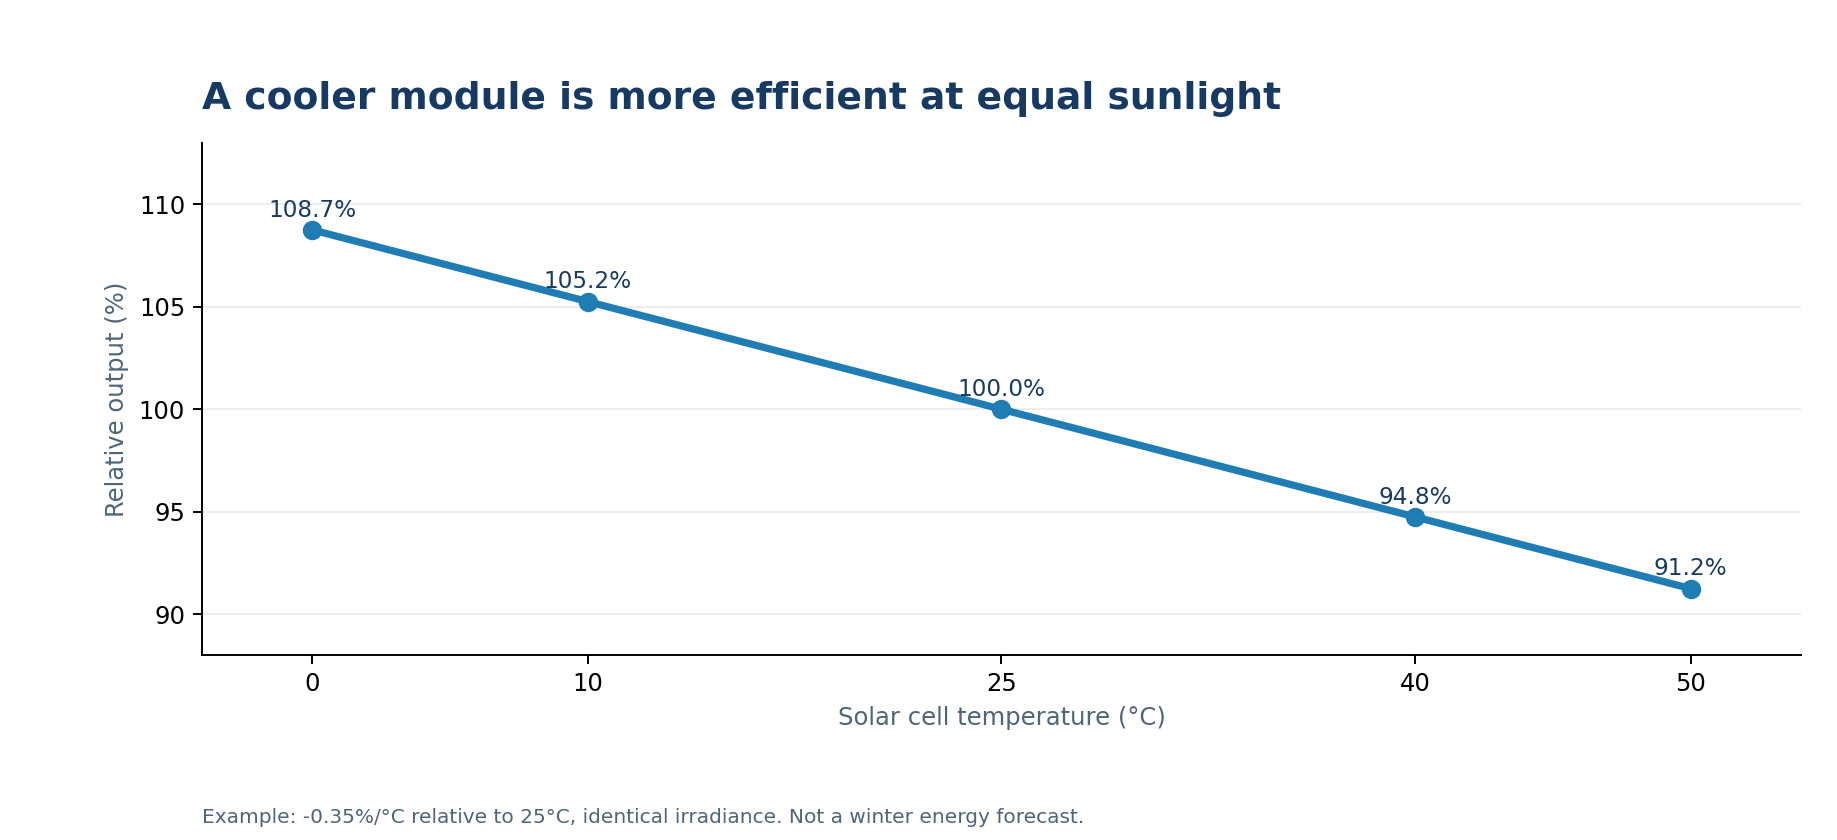
One of the most common misconceptions is that ‘panels produce less because it is cold’. For conventional silicon modules, the opposite is generally true. At equal irradiance, electrical output rises when the solar cells are cooler. Milieu Centraal gives a rule of thumb of about 3.5% less output per 10°C increase in module temperature.
The graph uses this as an example coefficient of −0.35% per degree, normalised to 25°C. Notice the difference between ambient temperature and solar cell temperature: those can be very different. Under strong sunlight, a module becomes much warmer than the surrounding air.
So cold modules are beneficial at equal sunlight. In Dutch winter conditions, however, the reduced amount of light is so significant that this small efficiency advantage cannot offset the seasonal drop.
8. Snow, frost, ice and dirt on the modules
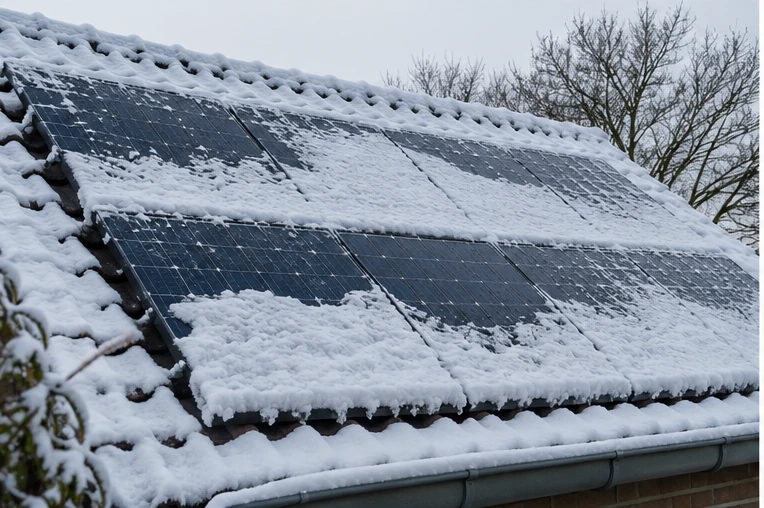
If snow completely covers the glass, a module can temporarily receive almost no light. On pitched roofs, snow often clears by itself as temperatures rise. Frost and thin ice may also have a temporary effect. Dirt, leaves and bird droppings can reduce irradiance too, but normal rain is generally enough to keep panels reasonably clean.
Never climb onto an icy or snow-covered roof just to recover a few kilowatt-hours. The personal safety risks and potential damage outweigh the small energy gain in most cases. Do not use ice tools, sharp objects, harsh chemicals or hot water. Persistent contamination can be assessed safely by a qualified specialist.
What if only part of one panel is covered? The effect on the rest depends on the electrical layout, bypass diodes and MPPT arrangement. Not every multi-input micro-inverter has a fully independent MPPT for every panel.
9. Roof pitch, orientation and season
Roof pitch affects more than the yearly total: it also changes the distribution between months. A steeper south-facing roof can be relatively favourable under a low winter sun, while a shallower roof often suits the higher summer sun. East-west arrays tend to spread production more across the morning and afternoon.
But winter optimisation should not become a goal in itself. Annual yield, self-consumption, shading, installation costs and roof loading also matter. Physically adjusting panels for winter is rarely the simplest or most economical solution for a typical home.
For a tailored monthly estimate, use the European PVGIS calculator. It estimates monthly production from location, roof pitch, orientation, temperature and long-term solar radiation.
10. What does the watt-peak rating mean?
A panel may be rated at 400 Wp. This is a laboratory rating under standard test conditions (STC, including 1,000 W/m² irradiance and a cell temperature of 25°C). It is not a promise that the panel supplies 400 watts throughout the year.
An inverter can sometimes show a respectable peak on a bright winter day, while the daily energy total remains low. Always distinguish W or kW (instantaneous power) from Wh or kWh (energy accumulated over time). Bills and yearly yield are about kWh, not the highest peak briefly reached on a winter afternoon.
Comparing winter and summer on the basis of a single peak number is therefore not useful.
11. Is low winter output a fault?
Usually not. First compare the same month in different years, ideally alongside weather data. Comparing a dark December with a bright June tells you little about the condition of the installation. Better still, compare actual production with a multi-year estimate for your specific roof.
Some signs deserve attention: recurring inverter fault messages, a complete group of panels consistently staying at zero while others operate normally, no production at all on a clear winter day, or visible damage. A qualified installer should investigate those symptoms.
Only check information you can safely access in monitoring software or on the outside of equipment. Do not open inverters, DC connectors or distribution boards for electrical measurements. Dangerous AC and DC voltages can be present in PV systems even when a switch appears to be off.
12. Do not blame the inverter too quickly
Under weak sunlight, an inverter may struggle to meet its minimum operating conditions. This can be normal in the morning and late afternoon. Behaviour varies by device and string design. A long period of low output is not, by itself, proof of a failed inverter.
For micro-inverters with two or four module inputs, pay attention to the actual configuration. The number of connected panels and the number of independent MPPTs are not always the same. If a multi-input inverter fails, several panels may stop generating together. Use fault codes and the manufacturer’s documentation rather than broad assumptions.
Also keep the opposite problem in mind: high grid voltage shutdowns generally become more likely during high export on sunny days than on dull winter days. That is a different issue requiring a different diagnosis.
13. How to check your own installation
A few checks can rule out many common misunderstandings without opening electrical equipment:
- Review daily and monthly production in the inverter app.
- Compare the same month in another year, rather than comparing with June.
- Check whether all relevant panels and inverters show a normal status.
- Review any fault codes for grid voltage, communications or insulation.
- From a safe location, look for persistent shade, leaves or snow cover.
- Use PVGIS as an independent reference for your roof and orientation.
Remember: the smart meter measures only your net exchange with the grid. Panel production can therefore be higher than recorded export. The difference is direct household use, not lost electricity.

14. Winter solar electricity after 2027
The Dutch annual netting scheme, known as saldering, ends on 1 January 2027. Grid import and export will therefore be treated differently financially. This does not change the amount of winter solar energy generated, but it changes how that production affects your bill.
Winter production is relatively low while many households need more electricity for lighting and heating. Consequently, a larger share of the available solar energy is often used directly in the home. That helps self-consumption, but it is rarely enough to cover the entire household energy demand.
A small home battery shifts energy from afternoon to evening; it does not store large amounts of summer electricity until January. A hot-water cylinder can buffer heat for hours or days, but it does not solve the large seasonal mismatch either.
15. Common misconceptions
‘Cold panels do not work.’ False: cooler cells are generally more efficient at the same irradiance.
‘Cloudy days always mean zero production.’ False: diffuse daylight also produces electricity, usually at a lower level.
‘If December gives only 2%, the system is faulty.’ Not necessarily: December represents around 2% of the year on average in the cited Dutch distribution.
‘A home battery lets me save summer electricity for winter.’ Not with common household batteries designed for daily energy shifting.
‘Clearing snow from solar panels will quickly pay off.’ Almost never enough to justify the fall risk or potential panel damage.
16. Conclusion: the energy has not disappeared
Solar panels continue working in winter. The main issue is the much smaller amount of solar radiation available. The sun is lower, days are shorter, cloud cover is more common and shadows grow longer. Cooler solar cells offer a small efficiency advantage, but that cannot overcome the larger seasonal effect.
Judge your installation by its annual total, monthly pattern and comparable weather conditions, not a single dark day in December. For a normal roof, low winter production is usually physics rather than a failure.
For a meaningful performance check, compare production data with a PVGIS estimate for your own location, roof pitch and orientation. That tells you much more than the highest number shown in an app.
Sources and verification
Monthly proportions are from Milieu Centraal/Siderea (1991–2020). The 6,000 kWh example is calculated from those percentages; it is not measured data or a yield guarantee. Shadow lengths are geometric calculations. The temperature chart isolates the effect at equal irradiance.
- Milieu Centraal – Hoe werken zonnepanelen?
- KNMI – Weinig winterzon: korte dagen versus lage zonnestand
- KNMI – Zonnestraling in december vergeleken met juni
- KNMI – Zonnig
- European Commission JRC – PVGIS grid-connected PV
- Techniek Nederland – Sneeuw op zonnepanelen? Laat het liggen!
- Rijksoverheid – Salderingsregeling stopt in 2027